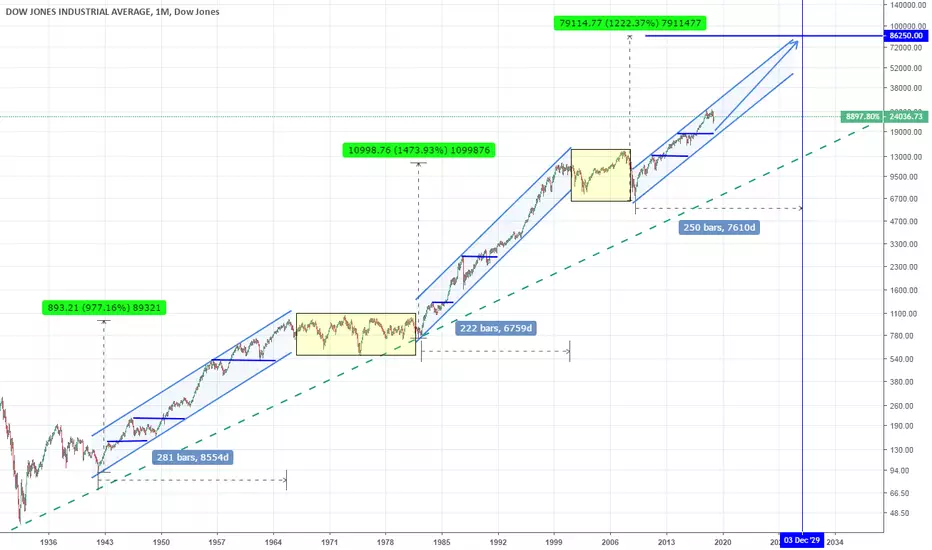
This study focuses on the very long term trading chart of Dow Jones since the Great Depression in an effort to determine if stock holding remains safe following the markets cyclical correction since last September.
So far during each of the post war bull cycles every cyclical correction within the channels was supported on the previous Higher High. The only exception was 1990 but was reasonable due to the 87 flash crash of Black Monday.
The growth and duration of the current bull cycle (following the sub-prime crisis) is calculated on the average values of the previous too, although based on the relative ratios, each bullcycle may tend to be more aggressive and grow more and each consolidation/ bear cycle shorter in duration.
What those metrics show is that the current cyclical correction should not exceed 18500 and if this low is made it should be inside 2019 and start recovering towards the end of the year. Quarterly investors can look to allocate 50% of their portfolio on the current prices and the other 50% close to 18500, in preparation for the second phase of the current bull cycle.
** If you like our free content follow our profile (tradingview.com/u/InvestingScope) to get more daily ideas. **
Comments and likes are greatly appreciated.
Telegram: t.me/investingscope
investingscope.com
Over 65% accuracy on Private Signals Channel.
Over 15% return monthly on our Account Management Plan.
Account RECOVERY services.
Free Channel: t.me/investingscopeofficial
investingscope.com
Over 65% accuracy on Private Signals Channel.
Over 15% return monthly on our Account Management Plan.
Account RECOVERY services.
Free Channel: t.me/investingscopeofficial
Disclaimer
The information and publications are not meant to be, and do not constitute, financial, investment, trading, or other types of advice or recommendations supplied or endorsed by TradingView. Read more in the Terms of Use.