📈 Dow Jones Weekly | Fibonacci Channel in Play Since 2020
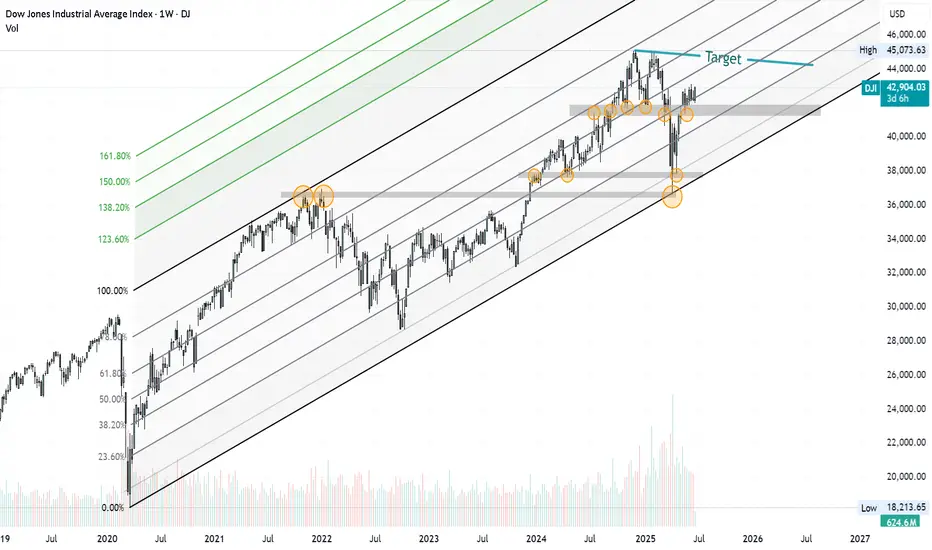
The Dow Jones Industrial Average has been trending within a well-defined Fibonacci channel on the weekly timeframe since the 2020 lows.
🔹 The price has consistently respected the Fibonacci levels as tilted support and resistance lines—a technical behavior that adds weight to this structure.
🔹 Three major horizontal support/resistance zones are clearly active and validated multiple times (highlighted on the chart).
🔹 Currently, the index is approaching the upper boundary of the downtrend resistance.
📌 The setup suggests it's only a matter of time before we retest this dynamic resistance zone, with potential rejection or breakout to follow.
🎯 Target zone around 45,000 as marked—aligning with previous highs and the upper resistance confluence.
Stay tuned—momentum is building.
#DowJones #DJI #FibonacciChannel #TechnicalAnalysis #WeeklyChart #StockMarket #Resistance #Support #Trendlines #ChartAnalysis #TradingView #US30 #MarketOutlook #PriceAction
Trade closed: target reached
Boom!Related publications
Disclaimer
The information and publications are not meant to be, and do not constitute, financial, investment, trading, or other types of advice or recommendations supplied or endorsed by TradingView. Read more in the Terms of Use.
Related publications
Disclaimer
The information and publications are not meant to be, and do not constitute, financial, investment, trading, or other types of advice or recommendations supplied or endorsed by TradingView. Read more in the Terms of Use.