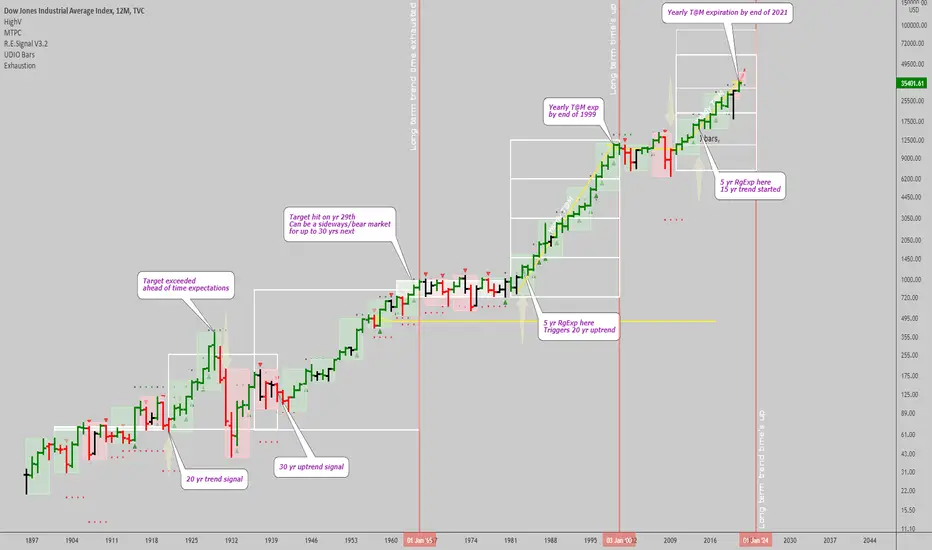
I plotted blocks of 5 years as bars and did the TM analysis for them, which shows a very interesting view of the long term trend cycles in equities since the start of the Dow Jones index. You can see how this helped prevent exposure to equities during the 70s for example, or guard against a decline back in 1929. As an exercise, it's highly interesting, but we also get a warning for current market cycles. The yearly trend in  DJI expires by end of 2021, and we are already beyond one target range for it, perhaps the next top is between 58k and 91k for the Dow Jones...by 2024 or sooner. Anything after 2022 is a dangerous zone already, from a TM perspective, personally I think the market will top next year, around May...as the Fed starts hiking, the timing matches various technical charts' timing expectations.
Best of luck navigating these murky waters ,
Ivan Labrie.
Best of luck navigating these murky waters ,
Ivan Labrie.
Trade active
Update: the action lately makes me think the beginning of the end already is here.Both
Note
Beginning of the end was correct...
Gold returns since: +8.98%
SPX returns since: -4.56%
In long term bear markets, buy commodities/value/defensive names/raise cash.
In long term bull markets: buy bonds/stocks/credit/cash is trash.
🔒Want to dive deeper? Check out my paid services below🔒
linktr.ee/ivanlabrie
linktr.ee/ivanlabrie
Disclaimer
The information and publications are not meant to be, and do not constitute, financial, investment, trading, or other types of advice or recommendations supplied or endorsed by TradingView. Read more in the Terms of Use.