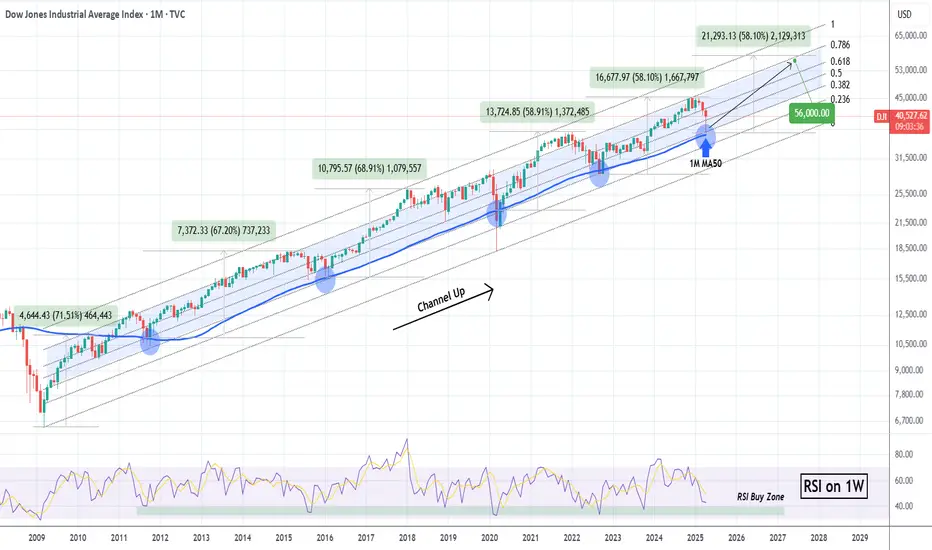
Dow Jones (DJI) will close the month today with a massive rebound 1M candle after almost touching its 1M MA50 (blue trend-line). Since the October 2010 break above the 1M MA50, after the market recovered from the 2008 Housing Crisis, the 1M MA50 has been the ultimate long-term Buy Entry as it has always signaled rallies that ranged from +58% to +67%.
The 1M MA50 has also kept the index mostly within the 0.382 - 0.786 Fibonacci range (blue zone) of the multi-year Channel Up. Given also that the 1W RSI also reached in April its ultimate Buy Zone (green), we view this as the best long-term Buy Signal the index handed to us since the September 2022 bottom of the Inflation Crisis.
Since the Bullish Legs that followed have been fairly consistent on average, we expect another 58% rise minimum. Assuming a 'bad-case' scenario of being contained within the 0.786 Fib, then a 56000 long-term Target seems more than fair.
Are you willing to go against this pattern?
-------------------------------------------------------------------------------
** Please LIKE 👍, FOLLOW ✅, SHARE 🙌 and COMMENT ✍ if you enjoy this idea! Also share your ideas and charts in the comments section below! This is best way to keep it relevant, support us, keep the content here free and allow the idea to reach as many people as possible. **
-------------------------------------------------------------------------------
💸💸💸💸💸💸
👇 👇 👇 👇 👇 👇
👑Best Signals (Forex/Crypto+70% accuracy) & Account Management (+20% profit/month on 10k accounts)
💰Free Channel t.me/tradingshotglobal
🤵Contact info@tradingshot.com t.me/tradingshot
🔥New service: next X100 crypto GEMS!
💰Free Channel t.me/tradingshotglobal
🤵Contact info@tradingshot.com t.me/tradingshot
🔥New service: next X100 crypto GEMS!
Disclaimer
The information and publications are not meant to be, and do not constitute, financial, investment, trading, or other types of advice or recommendations supplied or endorsed by TradingView. Read more in the Terms of Use.