D-JONES, It Will Be An Huge Historical Test In Stock-History!
Hello Traders Investors And Community, welcome to this analysis about the recent events, the current price-formation-structure and what we can expect the next times in one of the major leading stock-indices worldwide and one of the oldest participants in stock-markets the DOW JONES INDUSTRIAL AVERAGE, after we have seen the huge corona-crisis-breakdown which hit all global markets heavily we see a slowly moving uptrend right now, the big question which we have to ask our selves at the moment is if this uptrend is a stabile uptrend which will continue on a solid foundation or if it is just a huge bull-trap selling the shares to smart money on higher prices. As there are not only fundamental but also technical signals which I detected and which play an important role in the further outcome of the market we are looking at the 4-hour local timeframe.
When considering an index which builds the stock-market we have to also compare it with the current real economic situation and the things going on worldwide, and this situation is in fact a high volatile right now as the real economy is still damaged from the corona-crisis which has caused big failures due to lockdowns and the conservatism of the investors in this time. Also, we have massive protests going on worldwide which hasn't been seen since many 10th of years in that a mass-fashion. So taking all these factors together we can examine a divergence in the real economy and the stock market which shouldn't be the case because it is unnatural for the market and when it goes on for longer it has a big speculative impact on the market because the real economy isn't growing but the stock-market due to massive money printing from central banks, therefore, these two should build the same line together to provide a possibility for prosperity.
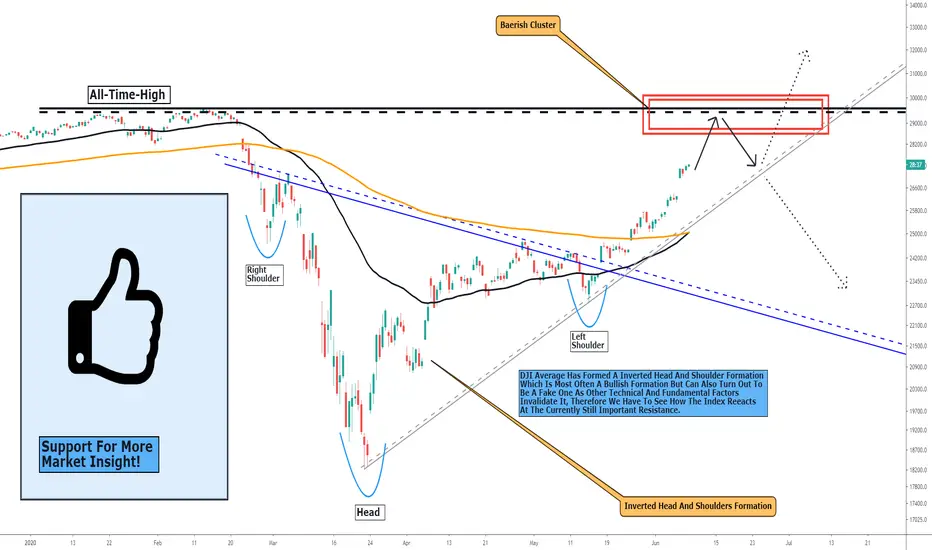
Technically speaking we see the index currently approaching a historical resistance level which is also the all-time-high-level you can see marked in my chart in red, when we approach this level firstly we can expect an pull-back because it is still a strong resistance level when this happened there are basically two possible scenarios which can play out within the index, once it is a second test of the resistance level where the price can succeed and make a new all-time-high to continue further and the second case will be that we break the current uptrend line you can see in my chart marked in grey to the downside which will cause bearish pressure and a test of the neckline of the inverted head and shoulder formation. When considering the bullish case it is important to keep in mind that the breakout needs to confirm with high volatility and sustainable price-action otherwise it can be a bull trap factly till the head and shoulders formation target confirmed.
It has to be noted that when we confirm a new high and advance further this will be a highly speculative rally as the real economy and the stock-market are still in divergence together firstly when these both run together we can get a healthy market environment. When considering the bearish side we can get bearish pressure after the uptrend line crossed to the downside, from that point it is possible for the index to test the neckline of the head and shoulder formation from where we can form a reversal and advance further but it can also turn out to come more bearish pressure to the downside which can invalidate the head and shoulder formation, therefore when we cross the 22690 mark to the downside this will get a definite bearish breakdown and need to be kept in the schedule for further considerations. At all the test of the resistance will be the critical factor in the further continuation of the index.
In this manner, thank you everybody for watching, support for more market insight and all the best!
There are many roads to prosperity in the modern economy, but one must be contemplated.
Information provided is only educational and should not be used to take action in the markets.
When considering an index which builds the stock-market we have to also compare it with the current real economic situation and the things going on worldwide, and this situation is in fact a high volatile right now as the real economy is still damaged from the corona-crisis which has caused big failures due to lockdowns and the conservatism of the investors in this time. Also, we have massive protests going on worldwide which hasn't been seen since many 10th of years in that a mass-fashion. So taking all these factors together we can examine a divergence in the real economy and the stock market which shouldn't be the case because it is unnatural for the market and when it goes on for longer it has a big speculative impact on the market because the real economy isn't growing but the stock-market due to massive money printing from central banks, therefore, these two should build the same line together to provide a possibility for prosperity.
Technically speaking we see the index currently approaching a historical resistance level which is also the all-time-high-level you can see marked in my chart in red, when we approach this level firstly we can expect an pull-back because it is still a strong resistance level when this happened there are basically two possible scenarios which can play out within the index, once it is a second test of the resistance level where the price can succeed and make a new all-time-high to continue further and the second case will be that we break the current uptrend line you can see in my chart marked in grey to the downside which will cause bearish pressure and a test of the neckline of the inverted head and shoulder formation. When considering the bullish case it is important to keep in mind that the breakout needs to confirm with high volatility and sustainable price-action otherwise it can be a bull trap factly till the head and shoulders formation target confirmed.
It has to be noted that when we confirm a new high and advance further this will be a highly speculative rally as the real economy and the stock-market are still in divergence together firstly when these both run together we can get a healthy market environment. When considering the bearish side we can get bearish pressure after the uptrend line crossed to the downside, from that point it is possible for the index to test the neckline of the head and shoulder formation from where we can form a reversal and advance further but it can also turn out to come more bearish pressure to the downside which can invalidate the head and shoulder formation, therefore when we cross the 22690 mark to the downside this will get a definite bearish breakdown and need to be kept in the schedule for further considerations. At all the test of the resistance will be the critical factor in the further continuation of the index.
In this manner, thank you everybody for watching, support for more market insight and all the best!
There are many roads to prosperity in the modern economy, but one must be contemplated.
Information provided is only educational and should not be used to take action in the markets.
Note
ANALYSIS UPDATE: The DOW pulled back in the range from where it formed a setup to continue with the next breakout.►✅JOIN THE BEST+ TOP TELEGRAM TRADING CHANNEL: t.me/VincePrinceForexGoldStocks
►🚀Write To Join the Elite VIP Signal Channels: @Vince_Prince
►🔥JOIN BYBIT TOP EXCHANGE►🎁 UP TO $30,000 BONUS NOW: partner.bybit.com/b/VinceByBit
►🚀Write To Join the Elite VIP Signal Channels: @Vince_Prince
►🔥JOIN BYBIT TOP EXCHANGE►🎁 UP TO $30,000 BONUS NOW: partner.bybit.com/b/VinceByBit
Disclaimer
The information and publications are not meant to be, and do not constitute, financial, investment, trading, or other types of advice or recommendations supplied or endorsed by TradingView. Read more in the Terms of Use.
►✅JOIN THE BEST+ TOP TELEGRAM TRADING CHANNEL: t.me/VincePrinceForexGoldStocks
►🚀Write To Join the Elite VIP Signal Channels: @Vince_Prince
►🔥JOIN BYBIT TOP EXCHANGE►🎁 UP TO $30,000 BONUS NOW: partner.bybit.com/b/VinceByBit
►🚀Write To Join the Elite VIP Signal Channels: @Vince_Prince
►🔥JOIN BYBIT TOP EXCHANGE►🎁 UP TO $30,000 BONUS NOW: partner.bybit.com/b/VinceByBit
Disclaimer
The information and publications are not meant to be, and do not constitute, financial, investment, trading, or other types of advice or recommendations supplied or endorsed by TradingView. Read more in the Terms of Use.