Those of you who are worried if the upcoming November U.S. Presidential Elections or medium-term pull-backs (such as those of July and April 2024 or August - October 2023), pose a threat to your investments, you have a strong reason to relax and feel safe and that is the current chart.
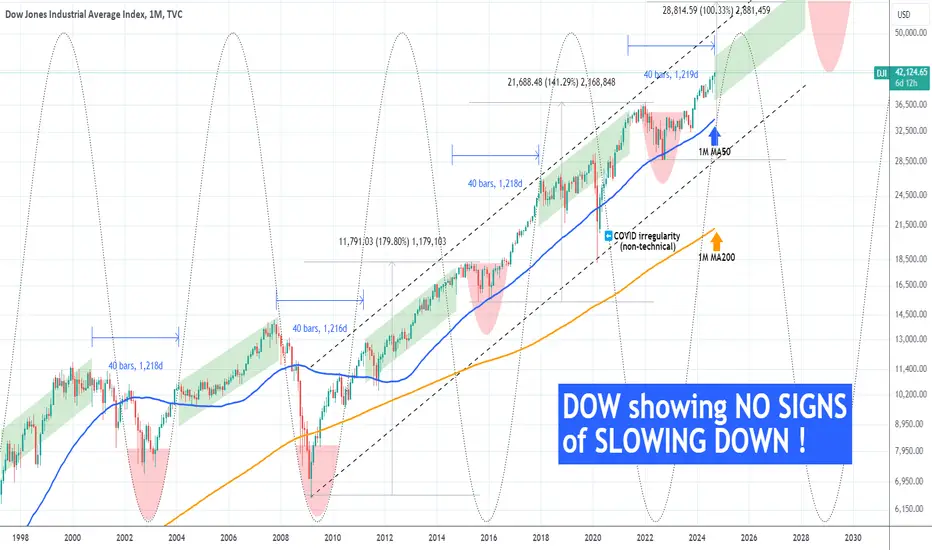
On this 1M time-frame analysis, we see Dow Jones (DJI) in almost the past 30 years (since late 1997) and the Cycles that have defined its Tops and Bottoms. As you can see, initially there is a clear (green) Channel Up that is always trading above the 1M MA50 (blue trend-line), leading to the eventual Top, which in turn initiates the Bear Cycle (red Arc).
The use of the Sine Waves make a great fit for the bottoms in particular. It is interesting to mention that the time period between the end of each (green) Channel Up and the start of the next one is approximately 40 months (3.3 years). Also since the 2008 Housing Crisis, we can see that a wide Channel Up has been the dominant pattern driving the expansion of Dow.
With the above information in mind, we can reach the conclusion that the index is only now entering that aggressive green Channel Up of the Bull Cycle, meaning that the Cycle is far from over and if anything, we are approaching its middle. In fact, the 3.3 year (40 month) time gap has just been completed, so there is a full Channel Up expansion ahead of us.
Now, how high can that get? Well if each Bullish Leg of the 2008 emerged Channel Up is 40% less than the previous, then we are looking for at least a +100% rise from the September 2022 bottom, giving us a rough 57000 Target on a 5-year horizon. Again that doesn't mean that we won't have medium-term pull-backs (like those mentioned in the opening paragraph) along the way, they are necessary and they reset the prices in order to attract more liquidity and investors, but on the long run you can feel comfortable holding your stocks.
-------------------------------------------------------------------------------
** Please LIKE 👍, FOLLOW ✅, SHARE 🙌 and COMMENT ✍ if you enjoy this idea! Also share your ideas and charts in the comments section below! This is best way to keep it relevant, support us, keep the content here free and allow the idea to reach as many people as possible. **
-------------------------------------------------------------------------------
💸💸💸💸💸💸
👇 👇 👇 👇 👇 👇
👑Best Signals (Forex/Crypto+70% accuracy) & Account Management (+20% profit/month on 10k accounts)
💰Free Channel t.me/tradingshotglobal
🤵Contact info@tradingshot.com t.me/tradingshot
🔥New service: next X100 crypto GEMS!
💰Free Channel t.me/tradingshotglobal
🤵Contact info@tradingshot.com t.me/tradingshot
🔥New service: next X100 crypto GEMS!
Disclaimer
The information and publications are not meant to be, and do not constitute, financial, investment, trading, or other types of advice or recommendations supplied or endorsed by TradingView. Read more in the Terms of Use.