You might not recognize this chart. To get some background on it, refer to the linked idea down below. You will find it in my profile.
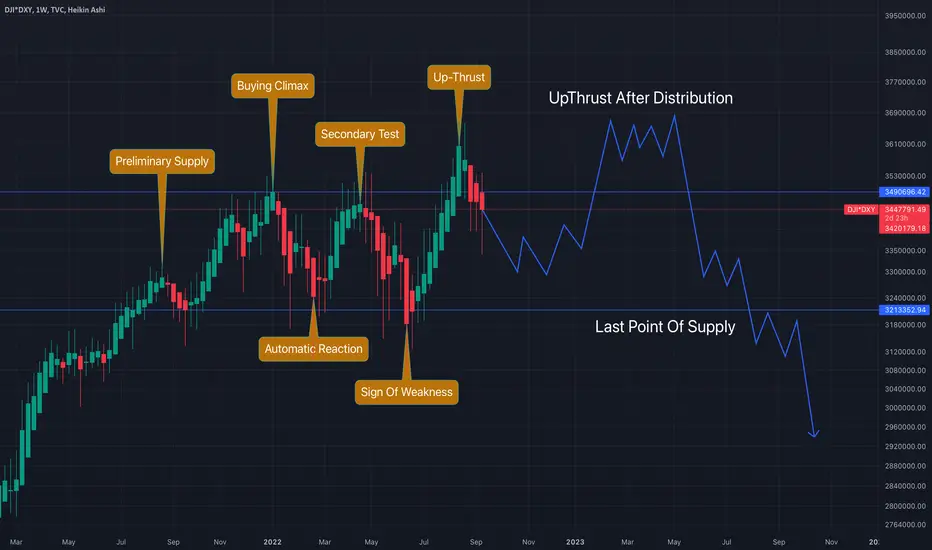
As it turns out,it looks like we are in a classic Wyckoff Distribution. It is remarkable that this is hidden beneath our noses.
The timing and the accuracy of the future phases may not be completely correct, the path is illustrative of the phases, it isn't drawn using wave theory.
I will gladly accept any helpful/corrective comments regarding this.
Tread lightly, for this is hallowed ground.
-Father Grigori
Note
Make sure to follow my previous idea linked below. You will get a new perspective of the September 13 selloff, and macro analysis using similar pairs like SPX*DXY and DJI/M2SL.Note
Note that Upthrust after distribution may not occur, instead last point of supply immediately follows. The timeline may vary significantly.Note
This even works for 2008, in a sloped fashion. This may not be entirely classical being sloped. I invented it just now.The white path is a sub-distribution. I invented it now as well.
Note
RevisedNote
The importance of normalization:Note
Look at this Head and Shoulders that is shaping in the RSI of SPXNote
If this chart is of any meaning (DXY*DJI/100), we have reached an important resistance level.Note
Update:Pattern taken from November 2000
Note
Are we in UTAD??Note
It's not just DJI which is in distribution, everyone is.The DXY comparison shows it more clearly.
Perhaps DJI will have an UTAD, while the others won't...
Note
There is a reason I tell you to tread lightly. Do you have an exit strategy?Note
Are we already in UTAD ???Note
Another long-term distribution! Inspired by SPY_Master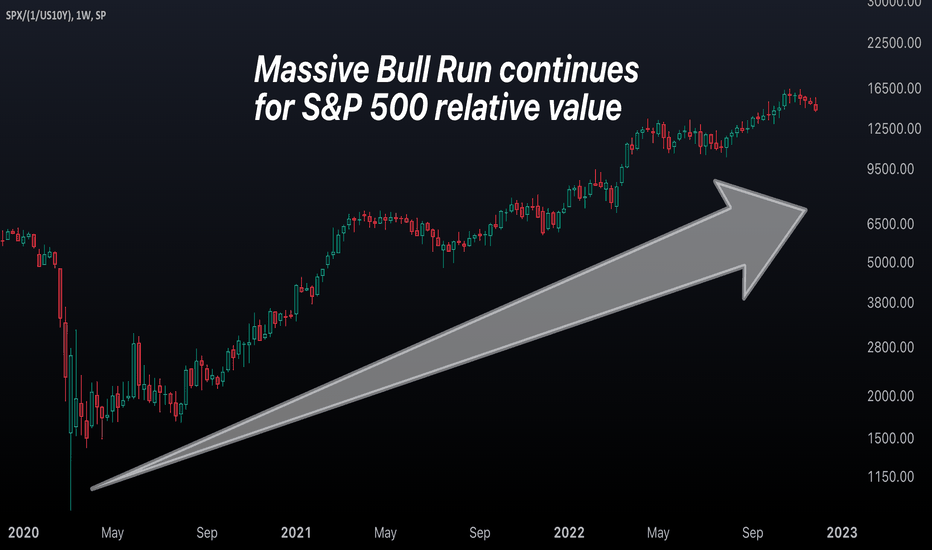
Note
A closeup, with a pattern from 2008Trade active
So far so good!Related publications
Disclaimer
The information and publications are not meant to be, and do not constitute, financial, investment, trading, or other types of advice or recommendations supplied or endorsed by TradingView. Read more in the Terms of Use.
Related publications
Disclaimer
The information and publications are not meant to be, and do not constitute, financial, investment, trading, or other types of advice or recommendations supplied or endorsed by TradingView. Read more in the Terms of Use.