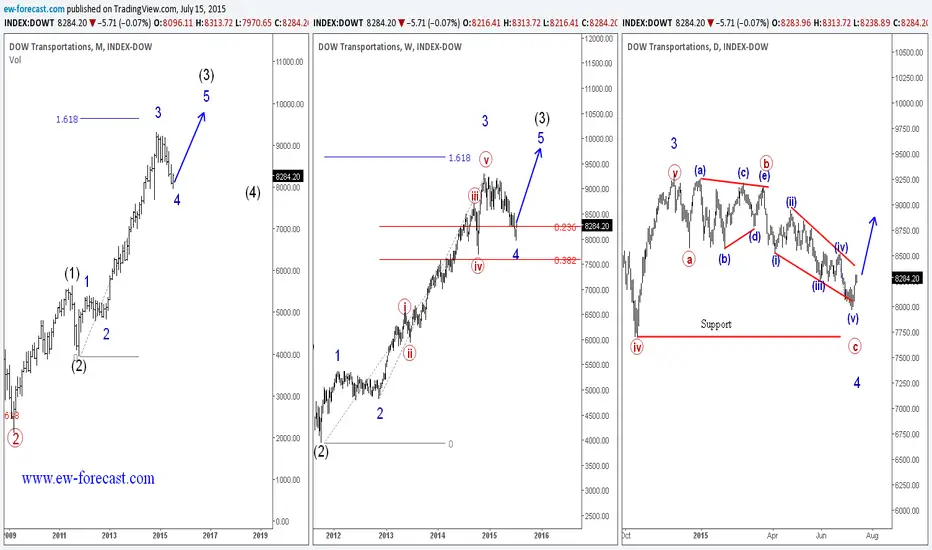
On the weekly chart of DOW Transportations index we can see that market has been trading bullish since the star of 2012. It has already made four waves up, with blue wave 5 in the making. On the Daily chart we see that price completed an ending diagonal in red wave c of blue wave 4. Price may now reach higher levels in blue wave 5.
ew-forecast.com
ew-forecast.com
US Single STOCKS (FREE Access), FX, Crypto
👉Explore Our Services @ wavetraders.com/elliott-wave-plans/
Learn Elliott Waves
👉 wavetraders.com/academy/
Newsletter Sign up
👉 bit.ly/3FVPVzO
👉Explore Our Services @ wavetraders.com/elliott-wave-plans/
Learn Elliott Waves
👉 wavetraders.com/academy/
Newsletter Sign up
👉 bit.ly/3FVPVzO
Disclaimer
The information and publications are not meant to be, and do not constitute, financial, investment, trading, or other types of advice or recommendations supplied or endorsed by TradingView. Read more in the Terms of Use.