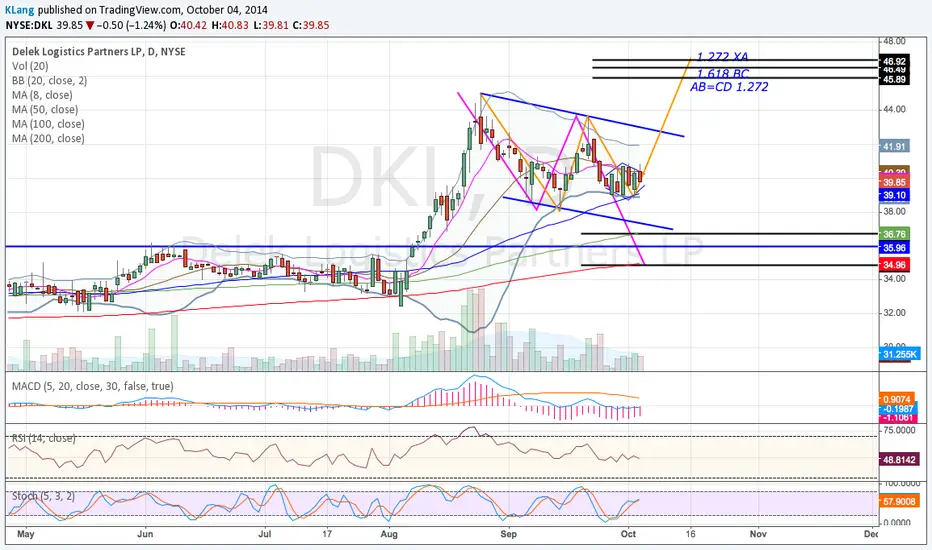
I'm publishing this so I can come back to it and see how it plays out. Could be BUTTERFLY. Could also be an AB=CD to the downside. Current formation looks like a small diamond which could break up or down. Could also be a Bear Flag. With the 50dma rising, there is a bullish slant. However, this is Oil Well Services, and energy has been hurting. No edge at all for me. Also, on the weekly, the Butterfly could be presenting a Bull Flag. It will be interesting to come back to this in a few weeks to see how it plays out. Also worth nothing the AB=CD equality lines up with the 100dma and the AB=CD 1.272 ext (common with the.786 retrace) lines up with the 200dma.
Disclaimer
The information and publications are not meant to be, and do not constitute, financial, investment, trading, or other types of advice or recommendations supplied or endorsed by TradingView. Read more in the Terms of Use.
Disclaimer
The information and publications are not meant to be, and do not constitute, financial, investment, trading, or other types of advice or recommendations supplied or endorsed by TradingView. Read more in the Terms of Use.