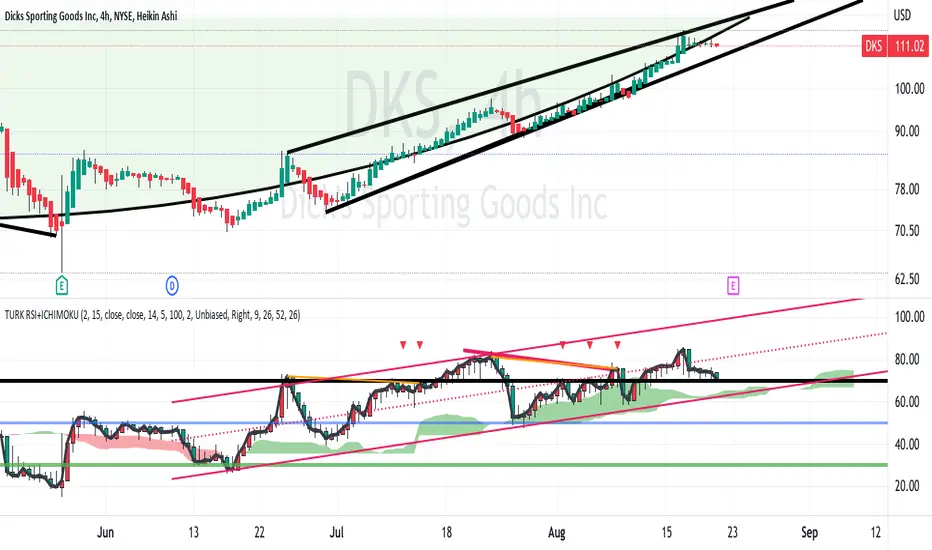
DKS has had increasing prices since the last earnings when it beat the estimates.
However, the price is ascending in a rising wedge which may suggest a breakdown.
While a breakout is possible it is less probable than a breakdown.
The chart has the rising wedge drawn in. The RSI indicator is suggestive
of bearish divergence in the past week. This may forecast a reversal in
the immediate term i.e. a breakdown.
All in all, I will take a put option with an expiration of September 2nd
at strike of $105 and watch for a reaction to earnings which ger reported
this week.
. DKS
DKS
However, the price is ascending in a rising wedge which may suggest a breakdown.
While a breakout is possible it is less probable than a breakdown.
The chart has the rising wedge drawn in. The RSI indicator is suggestive
of bearish divergence in the past week. This may forecast a reversal in
the immediate term i.e. a breakdown.
All in all, I will take a put option with an expiration of September 2nd
at strike of $105 and watch for a reaction to earnings which ger reported
this week.
.
Disclaimer
The information and publications are not meant to be, and do not constitute, financial, investment, trading, or other types of advice or recommendations supplied or endorsed by TradingView. Read more in the Terms of Use.
Disclaimer
The information and publications are not meant to be, and do not constitute, financial, investment, trading, or other types of advice or recommendations supplied or endorsed by TradingView. Read more in the Terms of Use.