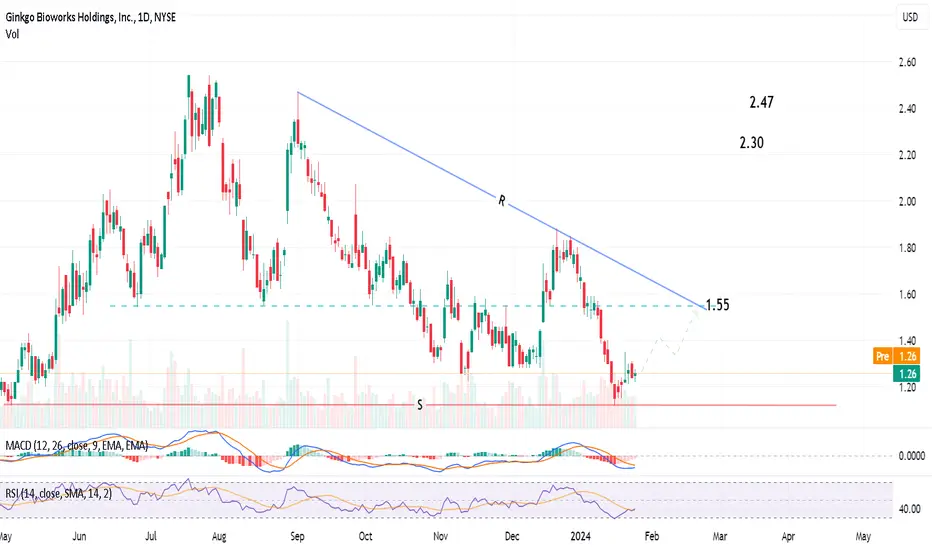
Daily chart, the stock rebounded from the support line S, and should target the falling Resistance line R at around 2.55
Crossing resistance and trading above 2.55 for 2 days, the target will be 2.30 extending to 2.47
Technical indicator RSI is in the BUY area.
Crossing resistance and trading above 2.55 for 2 days, the target will be 2.30 extending to 2.47
Technical indicator RSI is in the BUY area.
Disclaimer
The information and publications are not meant to be, and do not constitute, financial, investment, trading, or other types of advice or recommendations supplied or endorsed by TradingView. Read more in the Terms of Use.
Disclaimer
The information and publications are not meant to be, and do not constitute, financial, investment, trading, or other types of advice or recommendations supplied or endorsed by TradingView. Read more in the Terms of Use.