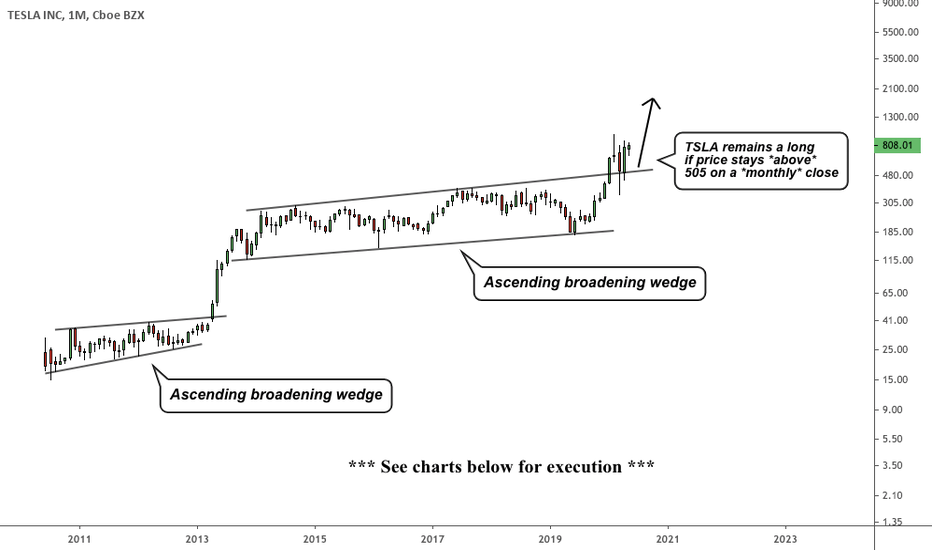
The major pattern above is an ascending broadening wedge just like the pattern in Tesla shown below.
Notice Tesla broke out of a major multi year (5 year) consolidation and developed a minor pattern above the breakout. After the minor pattern, Tesla shot to 2k + before announcing their split. Here's the analysis I did on Tesla just after it developed a minor pattern above the ascending broadening wedge:
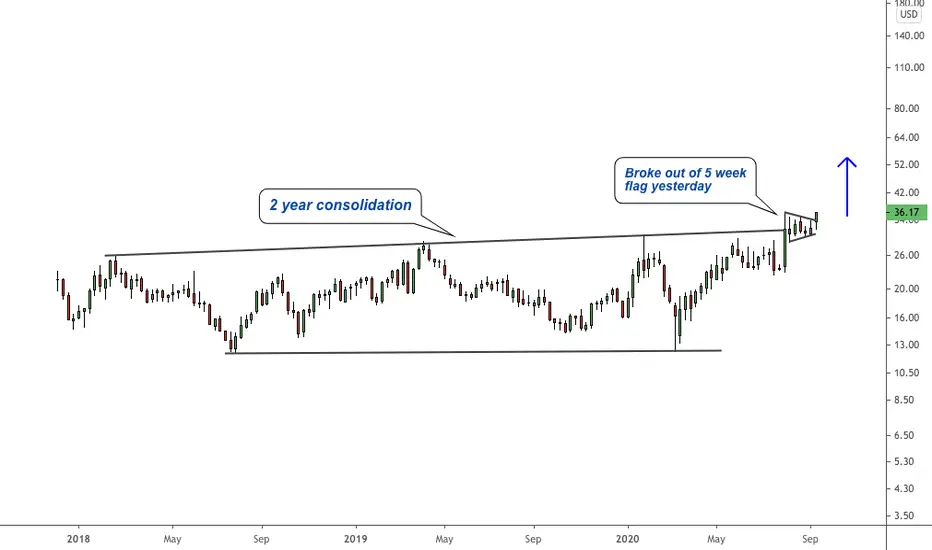
Here is the zoomed in Daily chart of DNLI:

This is a confirmed breakout on the smaller time-frame which gives the signal to get long.
Notice Tesla broke out of a major multi year (5 year) consolidation and developed a minor pattern above the breakout. After the minor pattern, Tesla shot to 2k + before announcing their split. Here's the analysis I did on Tesla just after it developed a minor pattern above the ascending broadening wedge:
Here is the zoomed in Daily chart of DNLI:
This is a confirmed breakout on the smaller time-frame which gives the signal to get long.
Note
I added another layer to my position at the market close at $35.40:Note
New all time highs:Note
New highs:Note
Now parabolic:Disclaimer
The information and publications are not meant to be, and do not constitute, financial, investment, trading, or other types of advice or recommendations supplied or endorsed by TradingView. Read more in the Terms of Use.
Disclaimer
The information and publications are not meant to be, and do not constitute, financial, investment, trading, or other types of advice or recommendations supplied or endorsed by TradingView. Read more in the Terms of Use.