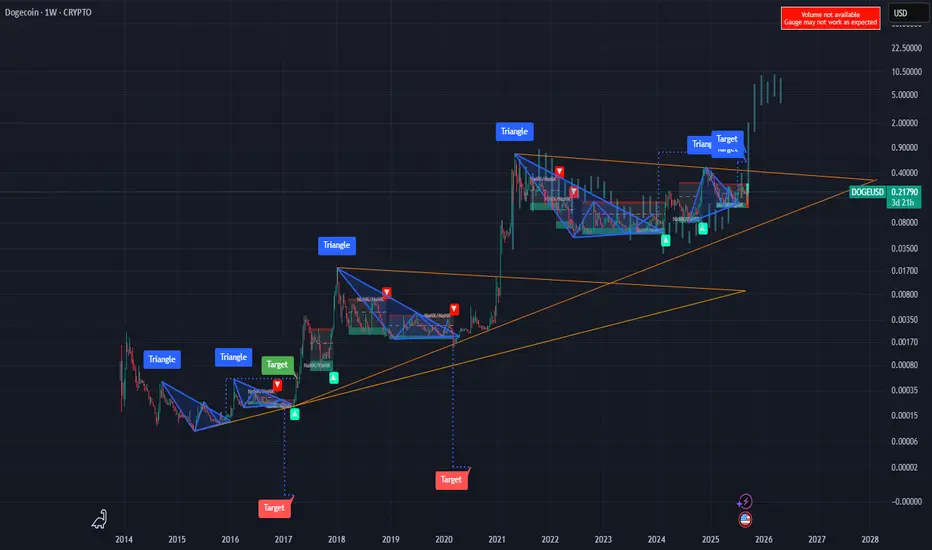
What we're looking at here is a high-timeframe logarithmic chart of Dogecoin, showing a massive ascending triangle/wedge structure that has been forming since as far back as 2014. On the log scale, this pattern becomes incredibly clear and highlights the consistent, long-term support line that has held through multiple market cycles. This isn't just a pattern; it's a story of accumulation and consolidation playing out over nearly a decade.
The Anatomy of the Trade: Fractals and the Ultimate Bear Trap
The structure of this chart is built on fractals. Notice how smaller triangle consolidations have repeatedly resolved to the upside, each breakout creating the foundation for the next, larger pattern. We are now in the final stages of the largest consolidation pattern, with price coiling tightly near the apex. This is the "calm before the storm," where maximum energy is being stored for an explosive move.
The ultimate setup here is a potential generational bear trap.
The Lure: A sharp, decisive dip below the multi-year logarithmic support trendline. This would be the signal many bears have been waiting for, a technical confirmation that the structure has failed, leading to mass selling and short positions.
The Trap: Instead of a continued meltdown, price action would see a violent reversal and reclaim the support line. This move would trap all the late shorts, triggering a massive squeeze.
The Launch: This squeeze would provide the rocket fuel necessary to break through the final overhead resistance of the triangle, likely sending DOGE into a new phase of parabolic price discovery.
The key takeaway is that while a breakdown could look terrifying, it might be the very catalyst needed for the next major bull run. For long-term bulls, any dip below this long-standing support—if it is quickly reclaimed—could represent a historic buying opportunity. Manage your risk accordingly.
Disclaimer
The information and publications are not meant to be, and do not constitute, financial, investment, trading, or other types of advice or recommendations supplied or endorsed by TradingView. Read more in the Terms of Use.
Disclaimer
The information and publications are not meant to be, and do not constitute, financial, investment, trading, or other types of advice or recommendations supplied or endorsed by TradingView. Read more in the Terms of Use.