🔄 Falling Wedge Breakout + Rounded Bottom
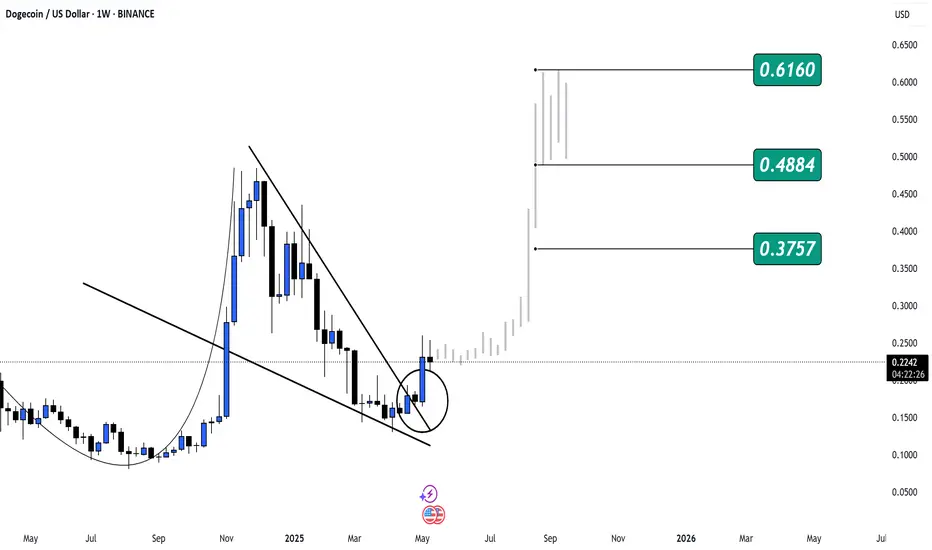
The chart shows a confirmed breakout from a classic falling wedge pattern, combined with a rounded bottom formation, signaling a strong potential for trend reversal to the upside in the mid-to-long term.
📍 The circled zone highlights the breakout point where bullish momentum accelerated.
🧠 Key Technical Points:
Previous buy zone: Around $0.17–$0.20
Current price: ~$0.225
Trend outlook: Bullish (after breakout confirmation)
Pattern: Falling Wedge + Rounded Bottom – both bullish indicators
🎯 Potential Price Targets:
Target 1: $0.3757 – Initial resistance and likely short-term target
Target 2: $0.4884 – Previous high and probable profit-taking level
Target 3: $0.6160 – Full measured move from wedge breakout
⚠️ Risk Zone / Invalidations:
A strong drop back below $0.20 could invalidate the breakout.
Re-tests of support before continuation are possible.
✅ Summary:
Dogecoin (DOGE) has broken out of a falling wedge with a clear rounded bottom, indicating bullish strength. Holding above $0.22 could lead to a rally toward $0.37, $0.48, and possibly $0.61 in the coming weeks.
Subscribe to my Telegram Channel 👉 :
t.me/addlist/y5mi70s3c0Y3MDQ0
Subscribe to my X 👉 : x.com/VIPROSETR
t.me/addlist/y5mi70s3c0Y3MDQ0
Subscribe to my X 👉 : x.com/VIPROSETR
Disclaimer
The information and publications are not meant to be, and do not constitute, financial, investment, trading, or other types of advice or recommendations supplied or endorsed by TradingView. Read more in the Terms of Use.