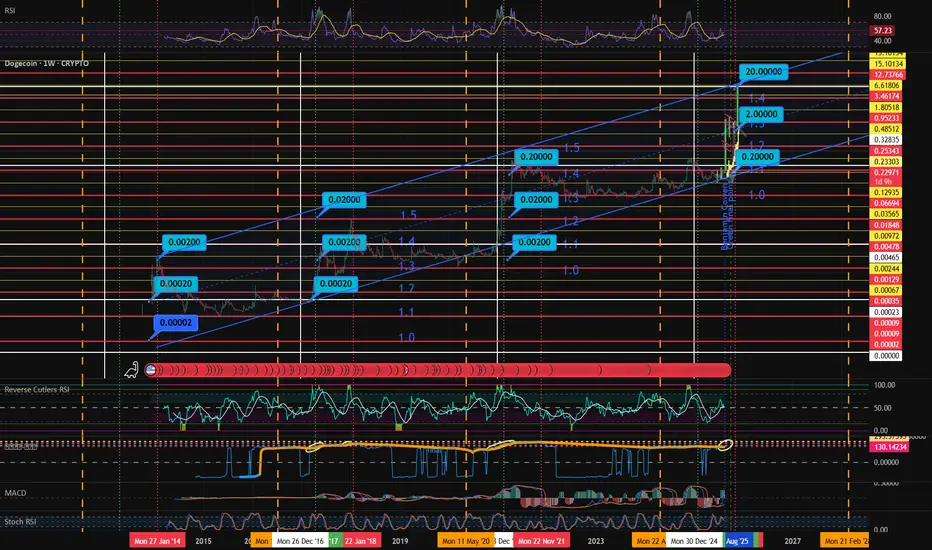
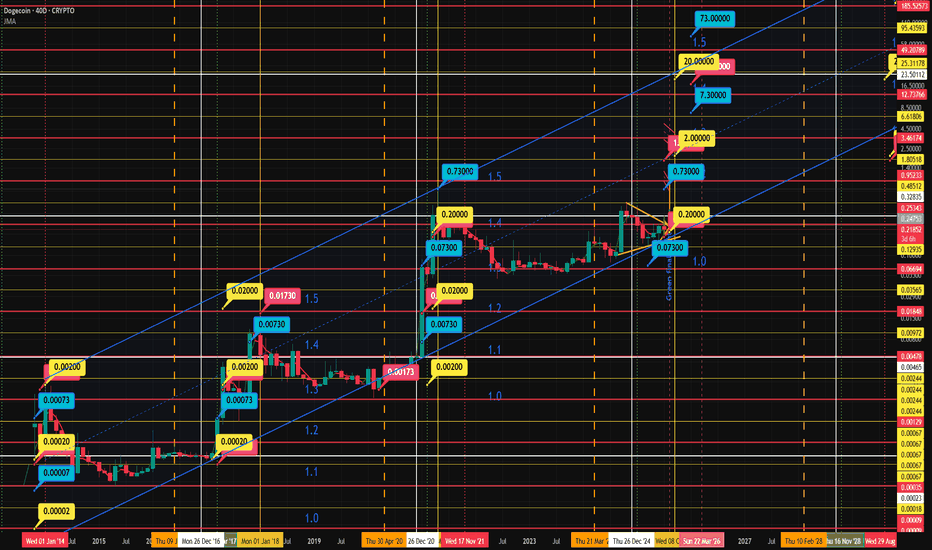
This chart displays Dogecoin (DOGE/USDT) on a weekly timeframe, highlighting its long-term price trend within an ascending channel since 2014. Key historical breakout levels are marked (e.g., $0.00002, $0.002, $0.02, $0.20, $2, and a projected $20 target), showing the repeating exponential growth cycles. The chart is overlaid with support and resistance zones, Fibonacci-like levels, and trend channels (1.0, 1.1, 1.2, 1.5). Vertical dotted and dashed lines mark important cycle dates and potential turning points. Current price action is consolidating near $0.23, with future targets extending to $2 and potentially $20 if the channel pattern continues.
Trade active
Disclaimer
The information and publications are not meant to be, and do not constitute, financial, investment, trading, or other types of advice or recommendations supplied or endorsed by TradingView. Read more in the Terms of Use.
Disclaimer
The information and publications are not meant to be, and do not constitute, financial, investment, trading, or other types of advice or recommendations supplied or endorsed by TradingView. Read more in the Terms of Use.