If the short-term fractals are kept aside, the long-term price action displays huge potential for a continued ascending trend. After the latest rejection from a resistance zone between $0.2180 and $0.2327, the bulls are trying hard to elevate the levels back above $0.2, but the bears seem to have capitulated the range just below the resistance.
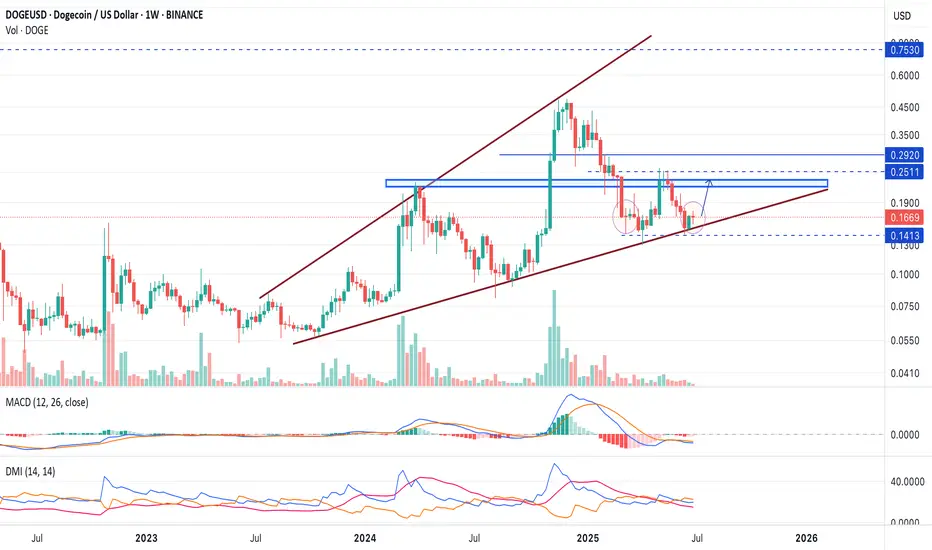
The weekly chart analysis suggests, the price has held the ascending trend line as a strong support and recently triggered a rebound. Besides, the weekly MACD, which has been within the negative range since the start of the year, displays a drop in selling volume and pressure. Meanwhile, the weekly DMI is about to turn bullish as the conversion line and base line are heading for a bullish crossover.
Key Technical Indicators Supporting the Rally
Golden Cross Formation: The 9 EMA has crossed above the 21 EMA—typically a bullish sign.
MACD Histogram: Green bars show growing positive momentum.
RSI Strength: RSI levels above 50 confirm bullish control.
Support Level: $0.155–$0.16
Resistance Target: $0.175–$0.18
A breakout above $0.18 could push DOGE toward the $0.20–$0.22 range, while a break below $0.155 might invite short-term pullbacks.
Disclaimer
The information and publications are not meant to be, and do not constitute, financial, investment, trading, or other types of advice or recommendations supplied or endorsed by TradingView. Read more in the Terms of Use.
Disclaimer
The information and publications are not meant to be, and do not constitute, financial, investment, trading, or other types of advice or recommendations supplied or endorsed by TradingView. Read more in the Terms of Use.