Pattern Observed:
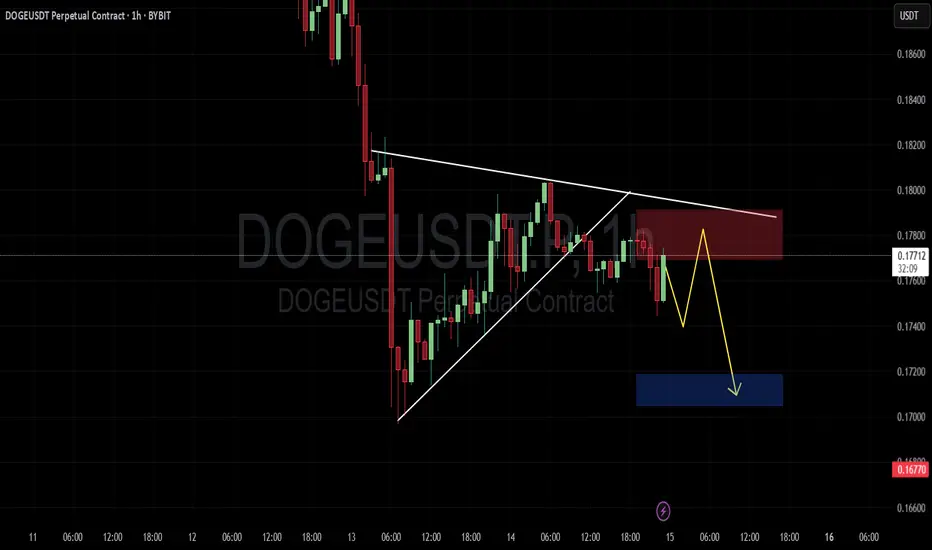
The chart shows a rising wedge that broke to the downside, a bearish continuation pattern.
Price attempted a retest to the wedge's base (marked in red zone), which aligns with lower highs — a strong sign of bearish rejection.
Key Zones:
Red Zone (Supply Zone / Resistance): Around 0.1775–0.1780
Acts as a bearish order block or supply area where price got rejected.
Blue Zone (Demand Zone / Bullish OB): Around 0.1705–0.1720
Anticipated target area where price might find support and possibly bounce.
Trade active
Took tp 1 Trade closed: target reached
doge dropped ! full tp hit
Note
pumped from blue zone
enjoy
Disclaimer
The information and publications are not meant to be, and do not constitute, financial, investment, trading, or other types of advice or recommendations supplied or endorsed by TradingView. Read more in the Terms of Use.
Disclaimer
The information and publications are not meant to be, and do not constitute, financial, investment, trading, or other types of advice or recommendations supplied or endorsed by TradingView. Read more in the Terms of Use.