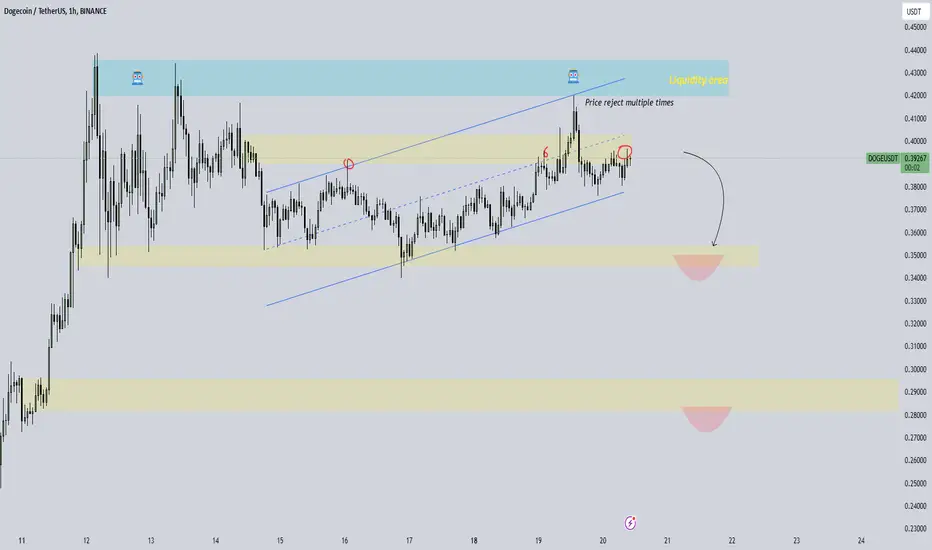
Doge Channel Price Analysis 📉:
The current price of Doge has recently encountered multiple rejections at the 0.39211 level 🚫, which is acting as a strong resistance. This means that the price has attempted to break above this level several times, but it has been unable to maintain its position above it. If the price continues to face rejection at this level, there could be more downward pressure ahead, with potential retests of lower support zones.
Resistance Level:
The immediate resistance area to watch is 0.39211 🔴. If the price fails to break above this resistance, it may struggle to move higher. However, if Doge manages to break through 0.39211, the next significant resistance comes in at 0.43243 💥. This is a critical price point that could signal a potential bullish breakout 🚀 if the price is able to push past it with strong buying momentum. Breaking through 0.43243 could open the door for further upside, and we may see Doge move higher toward new levels.
Support Areas:
On the other hand, if the price starts to decline, the first major support area to watch is 0.3573 🛑. This is a key level where the price could find buying interest and potentially bounce upward. If Doge fails to hold at 0.3573 and continues to fall, the next support level comes at 0.2843 🔻. This would be a critical point where the price could find significant support, and it might attract buyers looking to step in at a lower price. A bounce from this support could set the stage for a potential reversal and upward movement toward the resistance levels once again.
What to Watch For:
If the price respects the support areas at 0.3573 and 0.2843, we could see a reversal of the downward trend, with potential for a retest of the 0.39211 resistance. The price might start to move upward, especially if buying volume increases. 📈
On the flip side, if the price breaks below 0.2843, it may signal further downward momentum, and we might need to look at even lower support levels for potential price stabilization. ⚠️
In essence, Doge is currently in a crucial price channel, with multiple attempts to break resistance at 0.39211. If the price manages to break through the resistance, it could set the stage for an upward move to 0.43243. However, if it fails to hold the support levels at 0.3573 and 0.2843, we could see more downside. 📉
Key Takeaways:
Resistance at 0.39211 and 0.43243.
Support at 0.3573 and 0.2843.
Watch for signs of breakouts or bounces to determine the next potential move. 📊
Disclaimer: This is not financial advice ⚠️. Always perform your own research and due diligence before making any investment decisions. 📈💡
Disclaimer
The information and publications are not meant to be, and do not constitute, financial, investment, trading, or other types of advice or recommendations supplied or endorsed by TradingView. Read more in the Terms of Use.
Disclaimer
The information and publications are not meant to be, and do not constitute, financial, investment, trading, or other types of advice or recommendations supplied or endorsed by TradingView. Read more in the Terms of Use.
