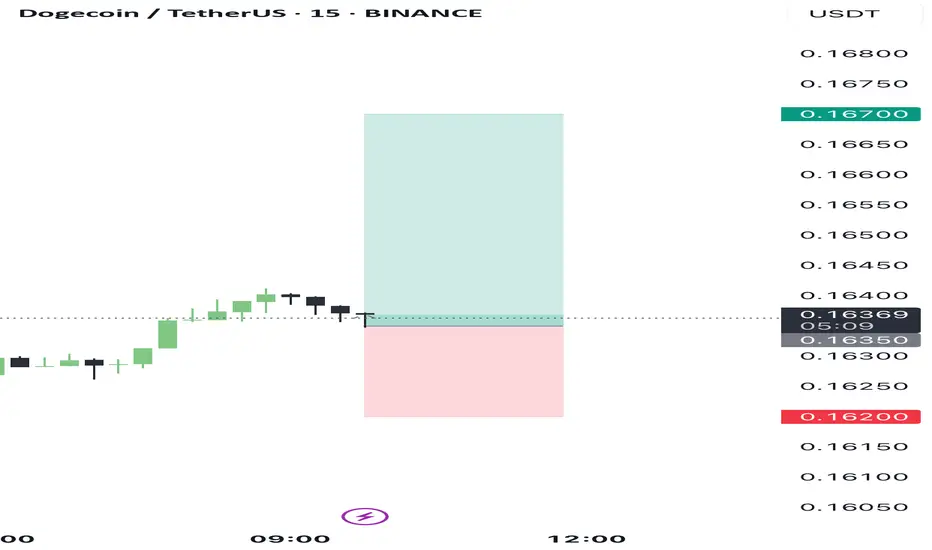
Analyzing the provided charts for Dogecoin/TetherUS across multiple timeframes, we observe a consistent pattern of consolidation and minor fluctuations within a defined range. The 1D chart shows a downtrend with recent attempts at recovery, marked by small bullish candles. The 4H and 1H charts indicate a ranging market with price oscillating around the 0.1635 to 0.1650 levels, suggesting a lack of strong directional momentum.
The 15M, 5M, and 1M charts further detail this consolidation, with price making higher lows and lower highs, indicative of a compression in volatility and potential preparation for a breakout. The repeated tests of the 0.1635 level across lower timeframes suggest it's a significant area of short-term support.
INSTITUTIONAL THESIS:
Institutions may be in a phase of accumulation within this range, using the lack of clear directional momentum to quietly build positions. The repeated support tests and tight consolidation indicate preparation for a potential upward move, as institutions capitalize on the compressed volatility to trigger a breakout.
Disclaimer
The information and publications are not meant to be, and do not constitute, financial, investment, trading, or other types of advice or recommendations supplied or endorsed by TradingView. Read more in the Terms of Use.
Disclaimer
The information and publications are not meant to be, and do not constitute, financial, investment, trading, or other types of advice or recommendations supplied or endorsed by TradingView. Read more in the Terms of Use.