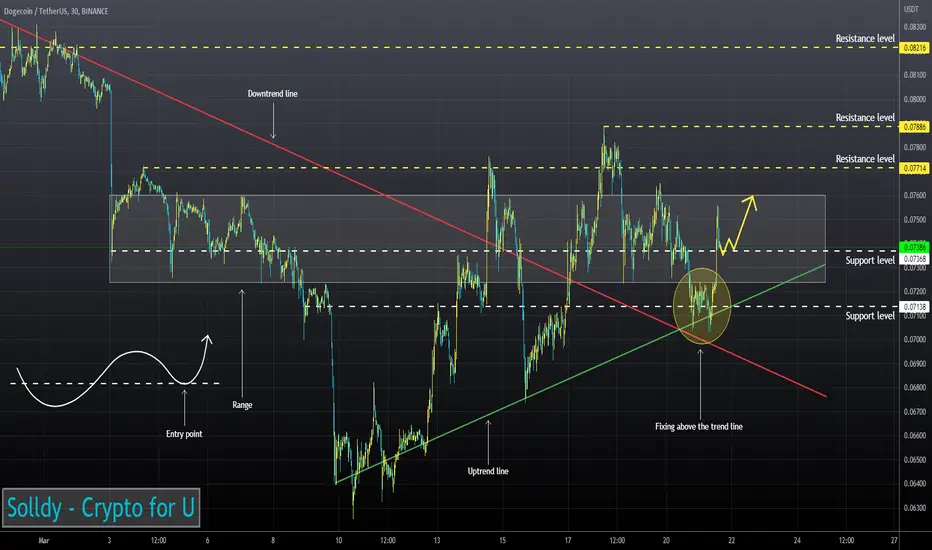
RSI chart is trading in the bullish zone (4H, 1H and 30m TFs)
Price has broken up 200EMA (1H TF)
I expect the asset to continue rising after a retest of support.
Price has broken up 200EMA (1H TF)
I expect the asset to continue rising after a retest of support.
Disclaimer
The information and publications are not meant to be, and do not constitute, financial, investment, trading, or other types of advice or recommendations supplied or endorsed by TradingView. Read more in the Terms of Use.
Disclaimer
The information and publications are not meant to be, and do not constitute, financial, investment, trading, or other types of advice or recommendations supplied or endorsed by TradingView. Read more in the Terms of Use.