DogeCoin (DOGE) technical analysis:
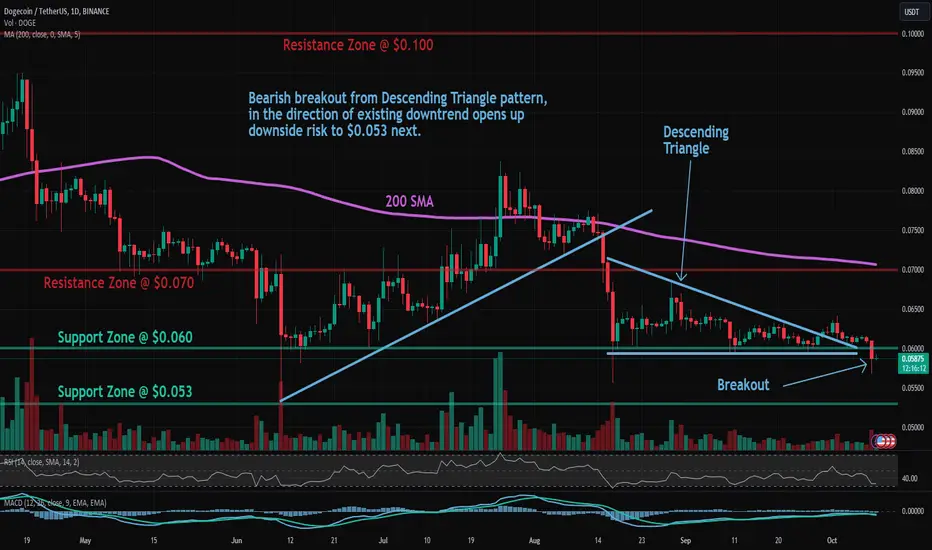
Trade setup: Bearish breakout from Descending Triangle pattern, in the direction of existing downtrend opens up downside risk to $0.053 next.
Trend: Downtrend across all time horizons (Short- Medium- and Long-Term).
Momentum is Bearish (MACD Line is below MACD Signal Line, and RSI is below 45).
Support and Resistance: Nearest Support Zone is $0.060, which it broke, then $0.053. The nearest Resistance Zone is $0.070 then $0.100.
Disclaimer
The information and publications are not meant to be, and do not constitute, financial, investment, trading, or other types of advice or recommendations supplied or endorsed by TradingView. Read more in the Terms of Use.
Disclaimer
The information and publications are not meant to be, and do not constitute, financial, investment, trading, or other types of advice or recommendations supplied or endorsed by TradingView. Read more in the Terms of Use.