Hello, fellow traders!
Follow me to get the latest information quickly.
Have a great day.
-------------------------------------
(DOGEUSDT 1M Chart)
I'm not sure if I should hold DOGE for the medium to long term.
However, if you plan to hold the coin for the medium to long term, I recommend increasing the number of coins (tokens) that represent profit.
The 0.21409-0.31600 range is an important high point boundary.
If this area supports the price and the price rises, a stepwise upward trend is likely.
To do so, we need to observe whether the price rises along the existing rising channel.
If the price falls below the downtrend line (1), we should stop trading and wait and see how things unfold.
-
(1W Chart)
A new channel has formed by breaking away from the downtrend line (2).
Therefore, the key question is whether the price can rise along this channel and rise above 0.37778.
If possible, I recommend finding support near 0.21409.
-
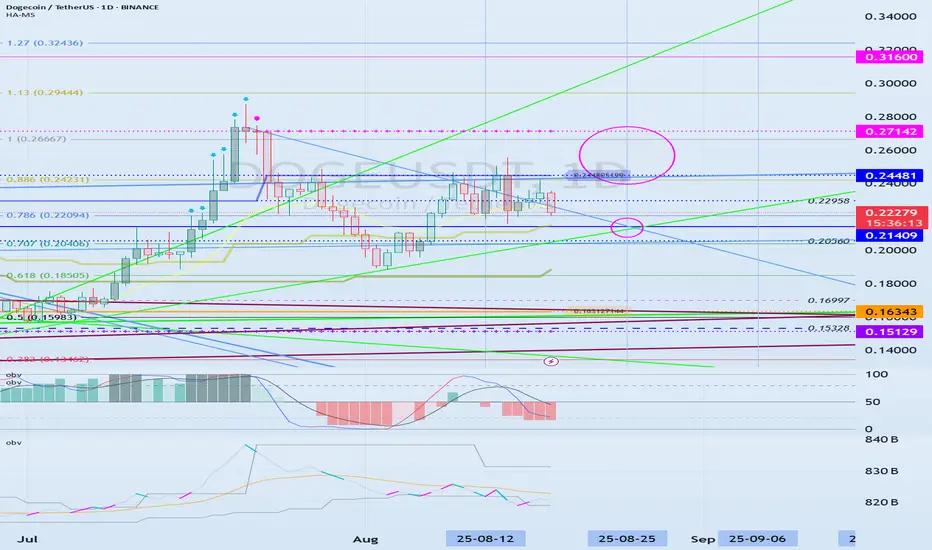
(1D Chart)
To form a channel, the key is to find support near 0.21409 and maintain the price above 0.24481.
To continue the stepwise uptrend, the price is expected to rise above 0.24481-0.27142.
If it falls below 0.21409, it is expected to meet the M-Signal indicator on the 1M chart and re-establish the trend.
The support level is 0.15129-0.16343.
-
Thank you for reading.
I wish you successful trading.
--------------------------------------------------
- This is an explanation of the big picture.
(3-year bull market, 1-year bear market pattern)

I will explain in more detail when the bear market begins.
------------------------------------------------------
※ Follow X to check out the posts.
※ X를 팔로우하고 게시물을 확인하세요.
◆ t.me/readCryptoChannel
[HA-MS Indicator]
bit.ly/3YxHgvN
[OBV Indicator]
bit.ly/4dcyny3
※ X를 팔로우하고 게시물을 확인하세요.
◆ t.me/readCryptoChannel
[HA-MS Indicator]
bit.ly/3YxHgvN
[OBV Indicator]
bit.ly/4dcyny3
Related publications
Disclaimer
The information and publications are not meant to be, and do not constitute, financial, investment, trading, or other types of advice or recommendations supplied or endorsed by TradingView. Read more in the Terms of Use.