On the 4H Timeframe, the asset price and the RSI chart have formed a bearish divergence confirmed by trading volumes.
The RSI chart went into the sellers area (1H and 30m TFs)
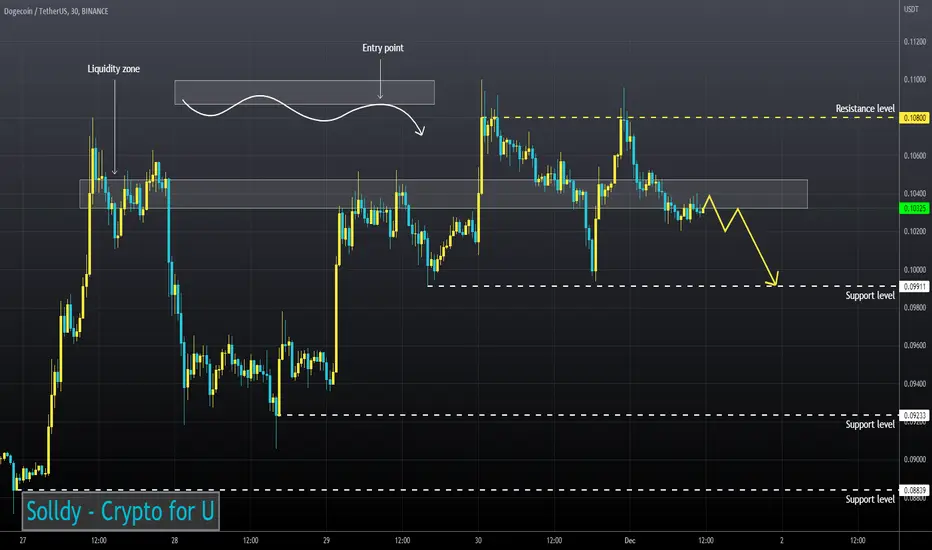
I expect a fall after the DOGE has fixed under the liquidity zone.
The RSI chart went into the sellers area (1H and 30m TFs)
I expect a fall after the DOGE has fixed under the liquidity zone.
Related publications
Disclaimer
The information and publications are not meant to be, and do not constitute, financial, investment, trading, or other types of advice or recommendations supplied or endorsed by TradingView. Read more in the Terms of Use.
Related publications
Disclaimer
The information and publications are not meant to be, and do not constitute, financial, investment, trading, or other types of advice or recommendations supplied or endorsed by TradingView. Read more in the Terms of Use.