🔍 Current Price Action:
Current Price: 0.19892 USDT
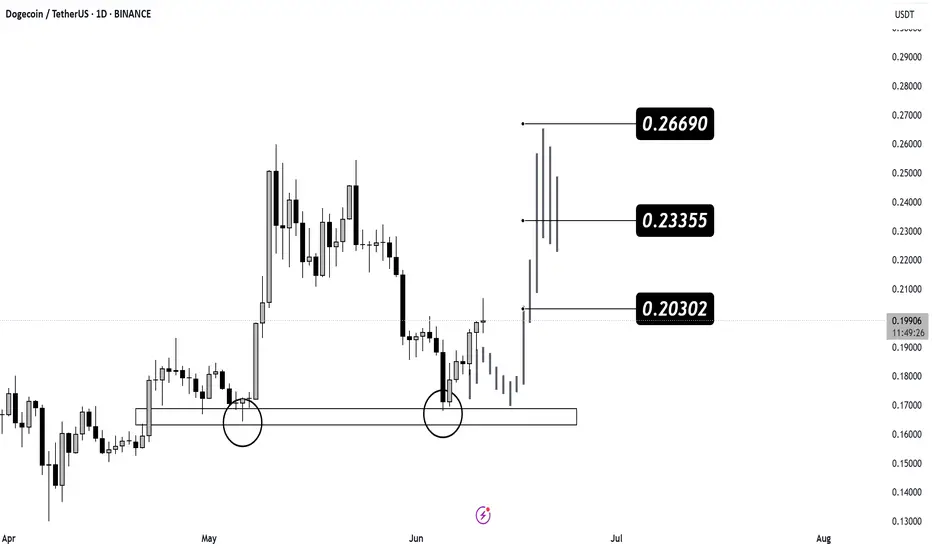
The price is reacting positively from a key support zone (highlighted with circles), indicating a strong bounce and potential for upward continuation.
📈 Target Resistance Levels:
0.20302 USDT – First short-term resistance, may be tested soon.
0.23355 USDT – Intermediate resistance; a key breakout level.
0.26690 USDT – Major resistance; target if momentum remains strong.
🧠 Technical Insights:
Pattern Observation: A double bottom-type reaction from support suggests bullish reversal.
Projected Gray Candles: Show a potential bullish scenario toward the next resistances.
Trend Outlook: Bullish bias remains as long as the price holds above the 0.185 area.
✅ Strategy Suggestion:
Entry Zone: Between 0.195 – 0.200 USDT (after confirmation of support hold)
Take Profits:
Target 1: 0.203
Target 2: 0.233
Target 3: 0.266
Stop Loss: Below 0.180 (to protect against failed support)
📌 Summary:
A strong bounce from a confirmed support zone gives DOGE potential for a continued rally toward 0.23–0.26 if the current momentum is maintained.
Subscribe to my Telegram Channel 👉 :
t.me/addlist/y5mi70s3c0Y3MDQ0
Subscribe to my X 👉 : x.com/VIPROSETR
t.me/addlist/y5mi70s3c0Y3MDQ0
Subscribe to my X 👉 : x.com/VIPROSETR
Disclaimer
The information and publications are not meant to be, and do not constitute, financial, investment, trading, or other types of advice or recommendations supplied or endorsed by TradingView. Read more in the Terms of Use.