Hello, traders.
If you "Follow", you can always get the latest information quickly.
Have a nice day today.
-------------------------------------
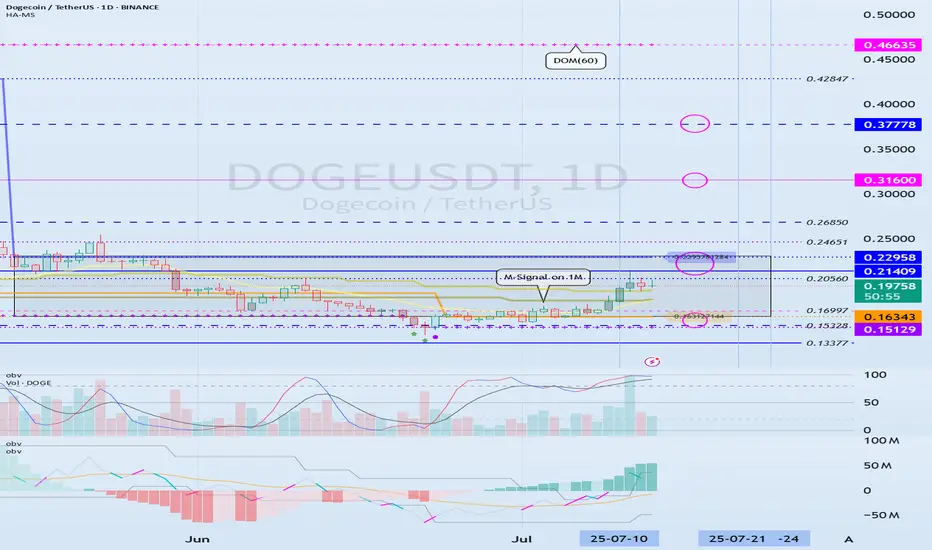
(DOGEUSDT 1D chart)
HA-High and HA-Low indicators are converging.
Accordingly, if it breaks through the 0.21409-0.22958 section, it is expected to surge.
However, since the DOM(60) indicator is formed at the 0.46635 point, we need to look at how the DOM(60) indicator is newly created.
It seems possible that the DOM(60) indicator will be newly created while shaking up and down in the 0.21409-0.31600 section, which is the HA-High indicator ~ DOM(60) indicator section of the 1M chart.
If the DOM(60) indicator is newly created, we need to check whether it is supported in the HA-High ~ DOM(60) section.
If it rises above the HA-High ~ DOM(60) section, it is likely to show a stepwise upward trend.
-
To summarize the above, it is as follows. - Buy range: 0.16343-0.22958
- Resistance range: 0.31600-0.37778
If the price breaks through the resistance range upward and maintains, there is a high possibility that the upward trend will continue in the medium to long term.
-
Thank you for reading to the end.
I hope you have a successful transaction.
--------------------------------------------------
- Here is an explanation of the big picture.
(3-year bull market, 1-year bear market pattern)

I will explain the details again when the bear market starts.
------------------------------------------------------
Other content (coins, stocks, etc.) is frequently posted on X.
X에 다른 내용(코인, 주식 등)이 자주 게시.
◆ t.me/readCryptoChannel
[HA-MS Indicator]
bit.ly/3YxHgvN
[OBV Indicator]
bit.ly/4dcyny3
X에 다른 내용(코인, 주식 등)이 자주 게시.
◆ t.me/readCryptoChannel
[HA-MS Indicator]
bit.ly/3YxHgvN
[OBV Indicator]
bit.ly/4dcyny3
Related publications
Disclaimer
The information and publications are not meant to be, and do not constitute, financial, investment, trading, or other types of advice or recommendations supplied or endorsed by TradingView. Read more in the Terms of Use.