The RSI chart indicates the strength of the buyers (4H and 1H TFs), and on the 30m Timeframe it is moving in the buyers zone.
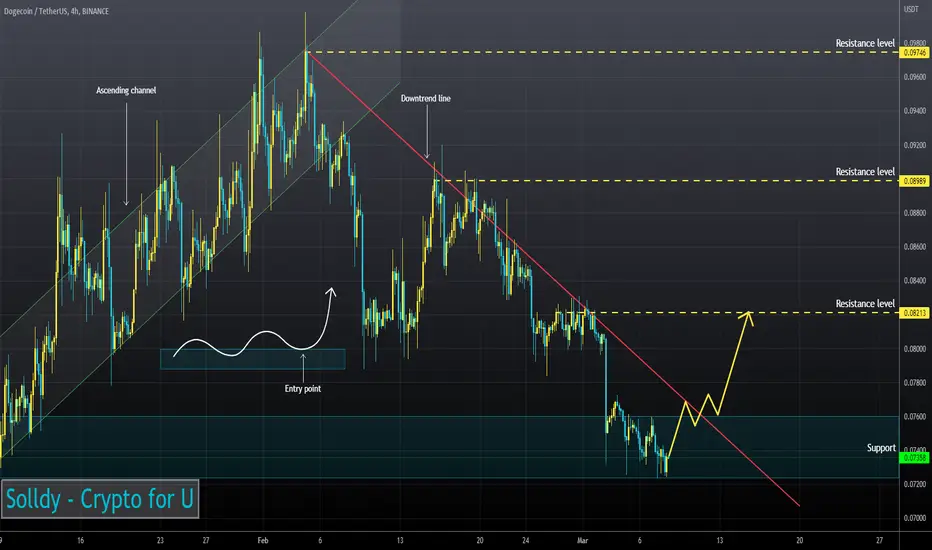
I believe that the asset will rise after it fixes above the support zone.
I believe that the asset will rise after it fixes above the support zone.
Disclaimer
The information and publications are not meant to be, and do not constitute, financial, investment, trading, or other types of advice or recommendations supplied or endorsed by TradingView. Read more in the Terms of Use.
Disclaimer
The information and publications are not meant to be, and do not constitute, financial, investment, trading, or other types of advice or recommendations supplied or endorsed by TradingView. Read more in the Terms of Use.