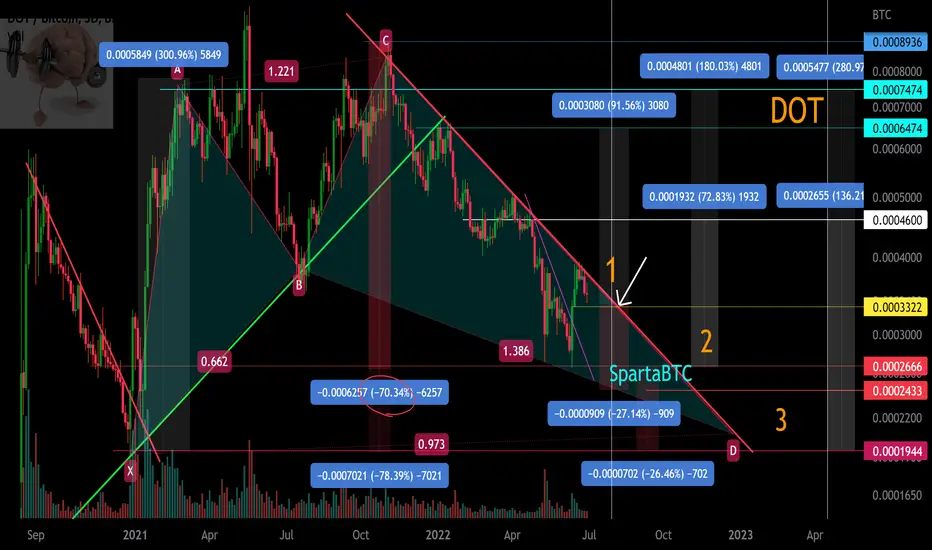
Main trend. Logarithmic graph. Timeframe 1 week.
A huge harmonious pattern is formed, with impressive target.
Very relevant work on this pair will be in the first place when bitcoin is “bad”.
The % growth / fall of the price in the event of the development of certain price movements (breakthrough / no breakthrough, fixing / not fixing) relative to key levels and zones is shown on the chart.
The same indicators on a line chart.

Secondary trend
DOT/BTC Secondary Trend
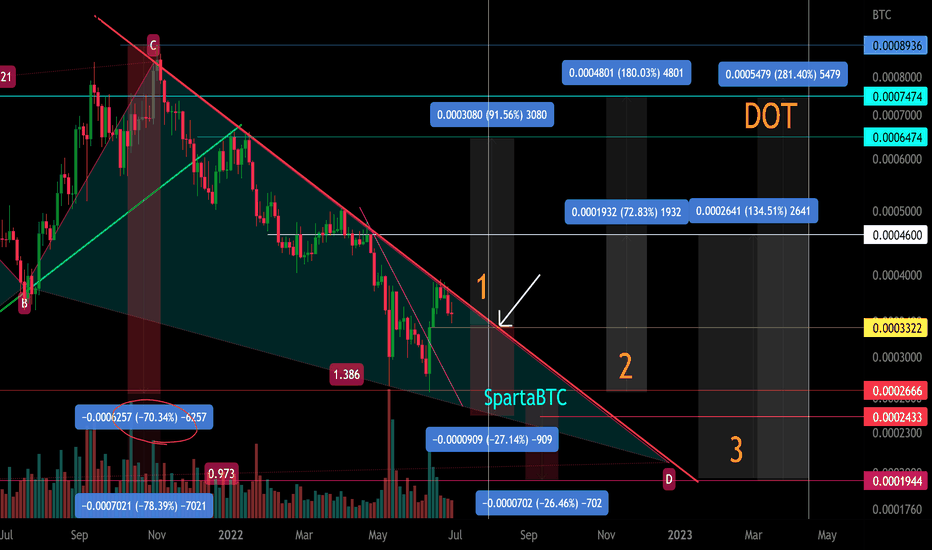
A huge harmonious pattern is formed, with impressive target.
Very relevant work on this pair will be in the first place when bitcoin is “bad”.
The % growth / fall of the price in the event of the development of certain price movements (breakthrough / no breakthrough, fixing / not fixing) relative to key levels and zones is shown on the chart.
The same indicators on a line chart.
Secondary trend
DOT/BTC Secondary Trend
Note
✅ Telegram. Finance + Trading: t.me/SpartaBTC_1318
✅ Telegram. Сrypto trading only: t.me/SpartaBTC_tradingview
✅ Instagram: instagram.com/spartabtc_1318
✅ YouTube (Rus): goo.su/vpRzRa2
✅ Telegram. Сrypto trading only: t.me/SpartaBTC_tradingview
✅ Instagram: instagram.com/spartabtc_1318
✅ YouTube (Rus): goo.su/vpRzRa2
Related publications
Disclaimer
The information and publications are not meant to be, and do not constitute, financial, investment, trading, or other types of advice or recommendations supplied or endorsed by TradingView. Read more in the Terms of Use.