Daily Chart
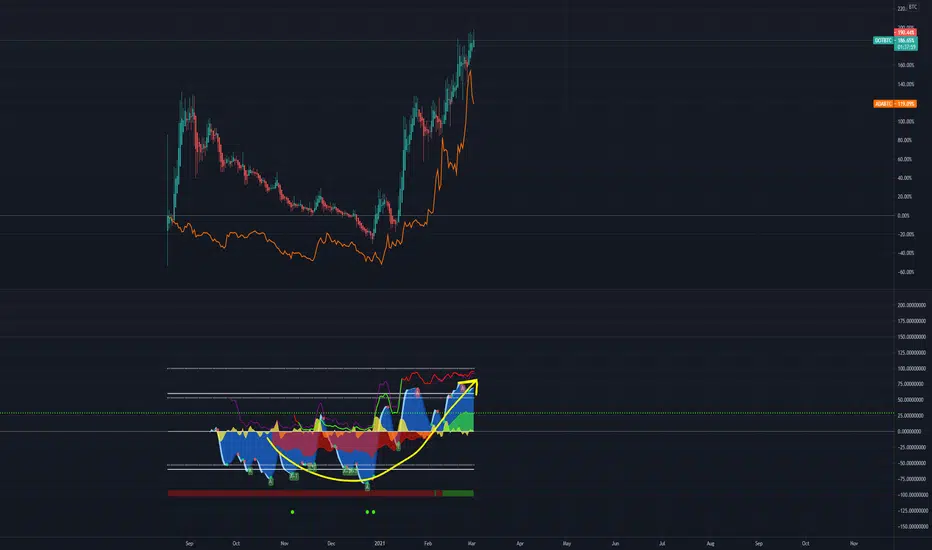
I am seeing a lot of money being put into altcoins based on money flow. This chart is DOT performance against BTC instead of USD. The huge negative moneyflow has completed around Feb 10th 2021 and now moving into Positive Green money flow. Momentum trading and accumulation is important when there is no price history for support and resistances. I put ADA in the chart to show how DOT will perform about the same. ADA has been around longer therefore more history for data points. What is happening to ADA will happen to DOT and a few other coins.
I am extremely bullish on DOT and therefore accumulated during the BTC downturn and hopeful of the launch in the first half of the year. I don't expect to hold DOT till end of this year. Can't go wrong in a bullish market right?
Disclaimer
The information and publications are not meant to be, and do not constitute, financial, investment, trading, or other types of advice or recommendations supplied or endorsed by TradingView. Read more in the Terms of Use.
Disclaimer
The information and publications are not meant to be, and do not constitute, financial, investment, trading, or other types of advice or recommendations supplied or endorsed by TradingView. Read more in the Terms of Use.