DOT has come to the lower band on the weekly chart. failed to break it which is a sign of bullish and trend reversal.
On the same weekly chart we have a hidden divergence and a pin ball candle on the week of 7/04/2025.
weekly divergence
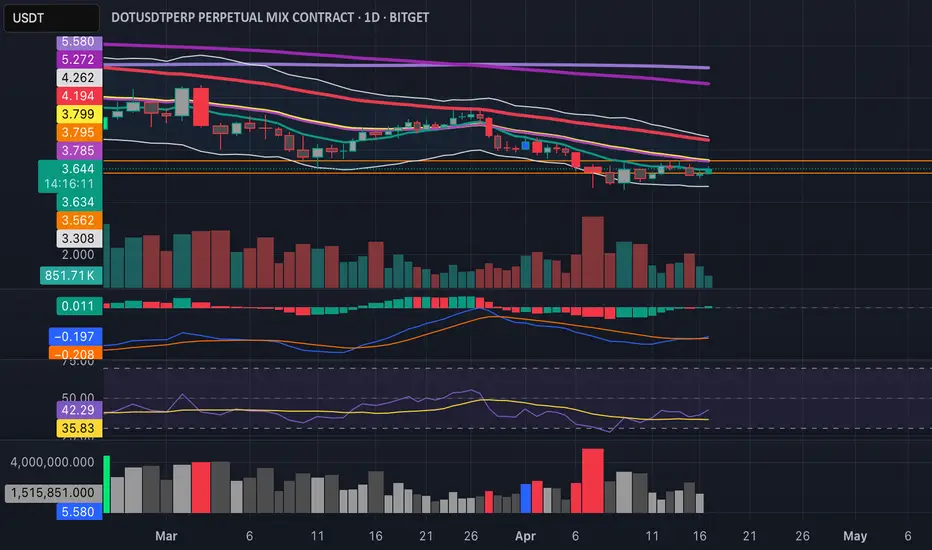
On the daily chart we have now formed a lower high with divergence.
Very bullish and BTCD is also showing signs of topping out
On the same weekly chart we have a hidden divergence and a pin ball candle on the week of 7/04/2025.
weekly divergence
On the daily chart we have now formed a lower high with divergence.
Very bullish and BTCD is also showing signs of topping out
Disclaimer
The information and publications are not meant to be, and do not constitute, financial, investment, trading, or other types of advice or recommendations supplied or endorsed by TradingView. Read more in the Terms of Use.
Disclaimer
The information and publications are not meant to be, and do not constitute, financial, investment, trading, or other types of advice or recommendations supplied or endorsed by TradingView. Read more in the Terms of Use.