Short
Domino's May Stop Delivering
I took requests on Twitter the other day and this stock came up. When I at first looked at the recent price action, I didn't see much right away, but I gained some clarity when I backed up.
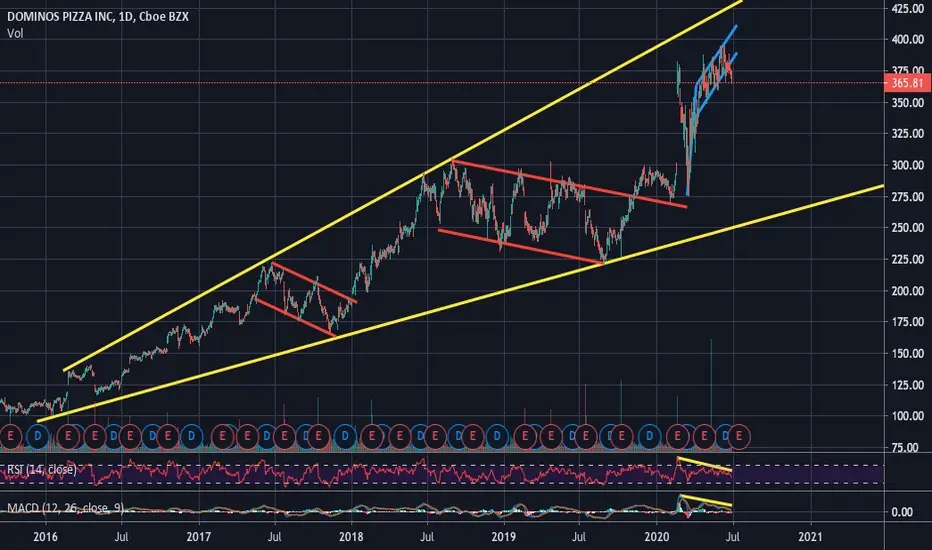
Back out all the way to a monthly chart and you might confuse this stock with a rocket ship company, given the verticality of its price action. However, in the time scale presented above, a clear rising broadening formation can be seen (yellow).
Now, is it bullish or bearish? The answer to that question depends on how early one can detect a pattern like this. If caught early, it can be very bullish, as it can help you capture the impulsive moves that take the price to the top trend line. And once you arrive, it can warn you of an impending period of consolidation. And we can clearly see those periods above (red).
Now, that said, where are we today? These patterns often resolve with the final thrust rolling over before ever getting to the top channel.
And sure enough that is just what we see here. This recent, rising, period of consolidation (blue) often fails to the downside.

After this final reversal, these patterns often ultimately resolve themselves with a failure of the lower (yellow) channel. So, at this point in the unfolding of this pattern, it is bearish. And it looks to have begun the process of failing from the recent rising flag already (blue).
Back out all the way to a monthly chart and you might confuse this stock with a rocket ship company, given the verticality of its price action. However, in the time scale presented above, a clear rising broadening formation can be seen (yellow).
Now, is it bullish or bearish? The answer to that question depends on how early one can detect a pattern like this. If caught early, it can be very bullish, as it can help you capture the impulsive moves that take the price to the top trend line. And once you arrive, it can warn you of an impending period of consolidation. And we can clearly see those periods above (red).
Now, that said, where are we today? These patterns often resolve with the final thrust rolling over before ever getting to the top channel.
And sure enough that is just what we see here. This recent, rising, period of consolidation (blue) often fails to the downside.
After this final reversal, these patterns often ultimately resolve themselves with a failure of the lower (yellow) channel. So, at this point in the unfolding of this pattern, it is bearish. And it looks to have begun the process of failing from the recent rising flag already (blue).
Note
Also note the strong bearish RSI and MACD divergences.Disclaimer
The information and publications are not meant to be, and do not constitute, financial, investment, trading, or other types of advice or recommendations supplied or endorsed by TradingView. Read more in the Terms of Use.
Disclaimer
The information and publications are not meant to be, and do not constitute, financial, investment, trading, or other types of advice or recommendations supplied or endorsed by TradingView. Read more in the Terms of Use.