Long
DSLA Protocol (DSLA) - 10x opportunity
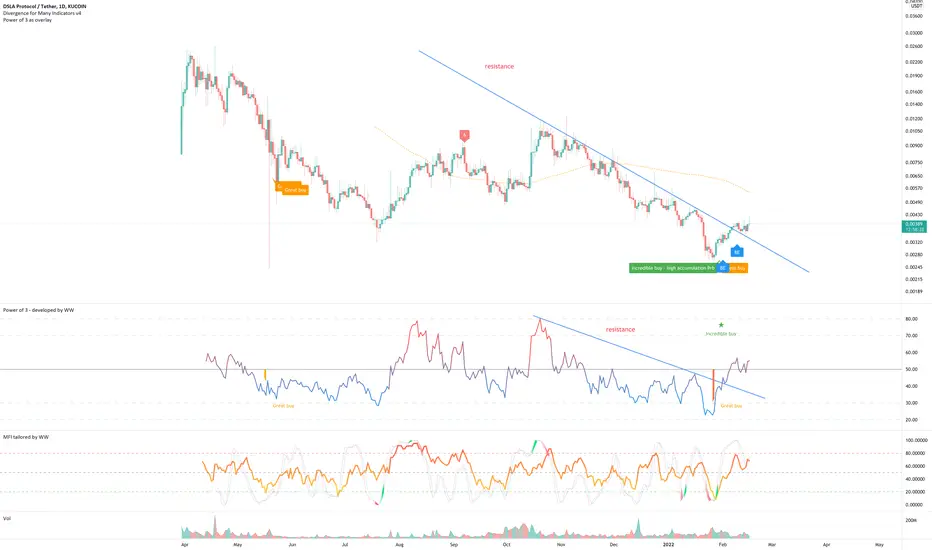
** high risk - $20m market cap - small position sizes only **
On the above 1-day chart price action has corrected a massive 90% from 2 cents back in April 2021. Now is an excellent time to be bullish. Why?
1) ‘Incredible buy’ signal prints.
2) Price action resistance breakout.
3) RSI resistance breakout.
4) Regular bullish divergence on the BTC pair. On the 4-day chart below a significant divergence is visible. A Dragonfly DOJI now prints.
Is it possible price action falls further? For sure.
Is it probable? Unlikely.
Good luck!
WW
PS: not in this trade so ask for updates below.
4-day BTC pair
Note
3-day overbought with bearish divergence BTC
bc1q2eckdzh0q8vsd7swcc8et6ze7s99khhxyl7zwy
Weblink: patreon.com/withoutworries
Allow 3-6 months on ideas. Not investment advice. DYOR
bc1q2eckdzh0q8vsd7swcc8et6ze7s99khhxyl7zwy
Weblink: patreon.com/withoutworries
Allow 3-6 months on ideas. Not investment advice. DYOR
Disclaimer
The information and publications are not meant to be, and do not constitute, financial, investment, trading, or other types of advice or recommendations supplied or endorsed by TradingView. Read more in the Terms of Use.
BTC
bc1q2eckdzh0q8vsd7swcc8et6ze7s99khhxyl7zwy
Weblink: patreon.com/withoutworries
Allow 3-6 months on ideas. Not investment advice. DYOR
bc1q2eckdzh0q8vsd7swcc8et6ze7s99khhxyl7zwy
Weblink: patreon.com/withoutworries
Allow 3-6 months on ideas. Not investment advice. DYOR
Disclaimer
The information and publications are not meant to be, and do not constitute, financial, investment, trading, or other types of advice or recommendations supplied or endorsed by TradingView. Read more in the Terms of Use.