Recent IPOs and speculative names, such as  BYND and
  UBER, have been gaining some attention these past few day. Other than being a speculative name,
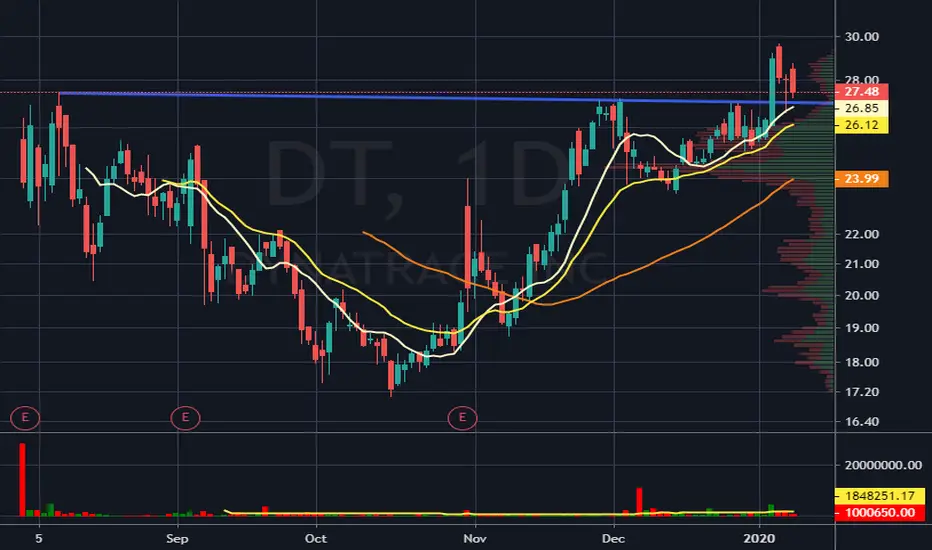
  DT has an amazing long setup. Recently DT broke out of it's flag pattern and made new highs for the first time since it's IPO release. DT pulled back into the breakout area and held with a beautiful Hammer Candlestick. When I saw this pattern yesterday, I wanted to enter long, however the R:R at the time was not favorable. Today I got another opportunity to enter with a good R:R as DT pulled back. I entered long at 27.75 with a stop loss below the hammer at 26.50. My target on the trade is 32.00.
Although I expectDT to make a higher low on the 30m chart, I do suspect DT to retest the breakout area again before taking off. Going to be patient with this one.
Although I expect
Note
Moved up stop loss to 27.10. Trade seems to be working. Expecting new highs this week.Note
DT is having a hard time staying above the 27.25 support level. After failing to hold new highs, DT flirted with support multiple times. Daily Chart looks to be forming an inside day following a bearish engulfing candlestick. Going to respect my 27.10 stop loss, however if DT breaks and holds below support I am thinking about a Contrarian Short Play at the failure. Trade closed manually
Exited this trade manually on 1/15/2020 but forgot to update my journal. I was debating on 1/15/2020 if I should exit this trade without it hitting my stop and I did. The reason was that even if DT recovers, the bullish pattern has already been invalidated and I thought DT is just going to chop sideways for the time being. This ended up being the case. This is a lesson of exactly what I should be doing when controlling time as well as price.Disclaimer
The information and publications are not meant to be, and do not constitute, financial, investment, trading, or other types of advice or recommendations supplied or endorsed by TradingView. Read more in the Terms of Use.
Disclaimer
The information and publications are not meant to be, and do not constitute, financial, investment, trading, or other types of advice or recommendations supplied or endorsed by TradingView. Read more in the Terms of Use.