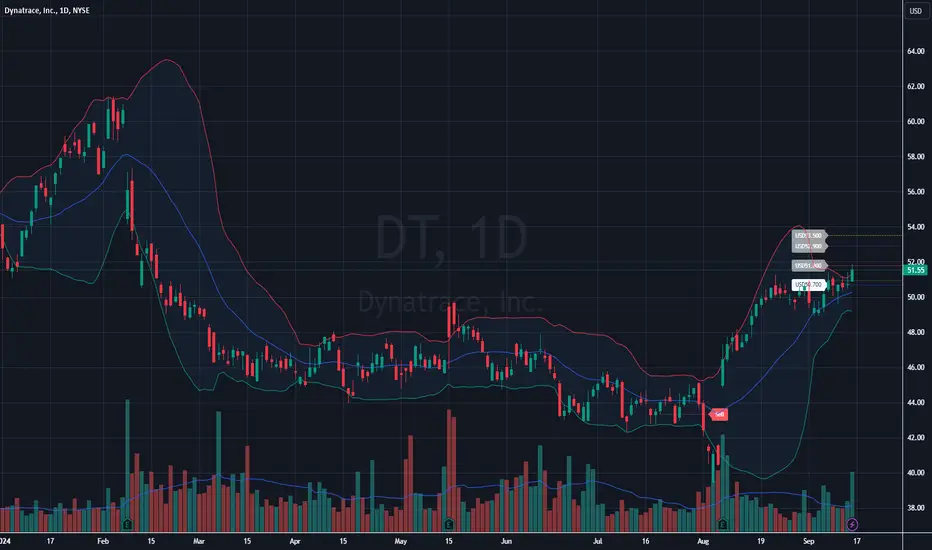
- The most recent candle shows a bullish movement with a gain of +1.60%.
- The Bollinger Bands show increasing volatility in recent days. The upper and lower bands are diverging, suggesting that price movements might become more extreme in the short term.
- There has been a spike in volume, with higher-than-average activity. Increased volume often signifies a stronger commitment to the direction of the price movement, in this case, bullish.
- This volume surge could be supporting the recent price breakout above resistance levels.
- Immediate resistance seems to be near $52.00 (just above the current price), with the next key level around $54.00 based on previous highs in April-May.
- Support lies around $50.00, with stronger support around $46.00-$48.00 where the price consolidated earlier.
- Short-term trend is bullish, with price holding above the middle Bollinger Band and recent higher highs being formed.
- There's a potential for a continuation if the price can maintain momentum and break through the $52.00 resistance level.
- Bullish Case: If the price continues to rise, breaking through $52.00, it could target $54.00 and higher levels, especially if supported by strong volume.
- Bearish Case: A pullback might occur if the price faces resistance at $52.00 or if the Bollinger Bands begin to contract. In that case, the price could test the middle band (around $48.00-$50.00) for support.
➀➁➂➃➄
Disclaimer
The information and publications are not meant to be, and do not constitute, financial, investment, trading, or other types of advice or recommendations supplied or endorsed by TradingView. Read more in the Terms of Use.
➀➁➂➃➄
Disclaimer
The information and publications are not meant to be, and do not constitute, financial, investment, trading, or other types of advice or recommendations supplied or endorsed by TradingView. Read more in the Terms of Use.