Good news for Duolingo... The chart is now showing some promising signs that it might be ready to turn things around and head higher. Some simple clues why:
Is it possible price action continues to print lower lows? Sure.
Is it probable? No.
Ww
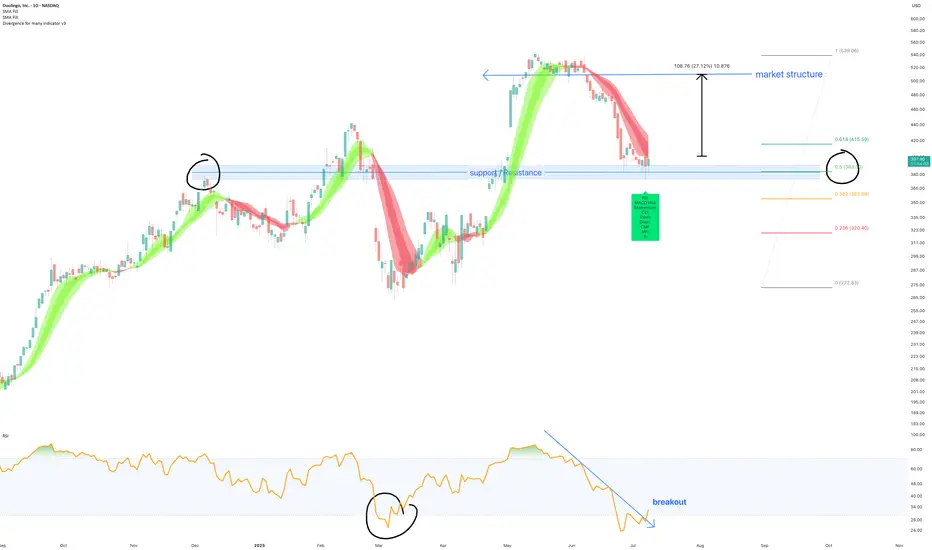
RSI resistance breakout:
The "RSI" indicator (bottom of chart) tells us strength is returning. A break of resistance that has been active over the last month is now no more. This usually means the buyers are taking control again.
Hidden strength:
Even though the price might look a bit sleepy, oscillators now print significant bullish divergence with price action.
Past resistance confirms support:
Certainly one of the most simplest concepts to take advantage of, previous resistance now confirms support. This test occurs as price action strikes the 50% Fibonacci level.
20% Forecast
Look left, previously market structure failed. Typically past breaks of structure shall be tested to confirm resistance, which is between 20-30% away.
Is it possible price action continues to print lower lows? Sure.
Is it probable? No.
Ww
Trade active
BTC
bc1q2eckdzh0q8vsd7swcc8et6ze7s99khhxyl7zwy
Weblink: patreon.com/withoutworries
Allow 3-6 months on ideas. Not investment advice. DYOR
bc1q2eckdzh0q8vsd7swcc8et6ze7s99khhxyl7zwy
Weblink: patreon.com/withoutworries
Allow 3-6 months on ideas. Not investment advice. DYOR
Disclaimer
The information and publications are not meant to be, and do not constitute, financial, investment, trading, or other types of advice or recommendations supplied or endorsed by TradingView. Read more in the Terms of Use.