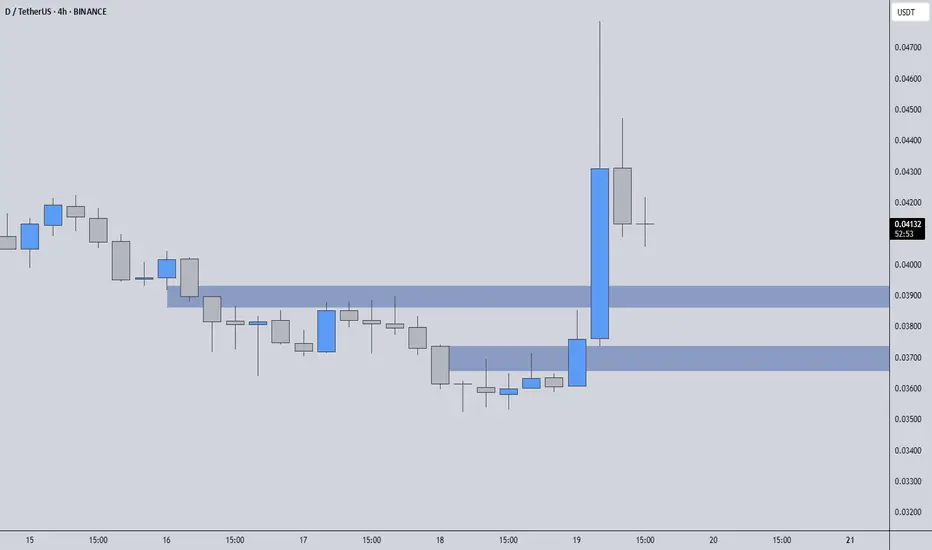
While I have no intention of holding DUSDT for the long term, the recent structure suggests that there could be a second wave of upside potential. The blue boxes on the chart represent areas where buyers have previously stepped in, and they may serve as useful entry zones for short-term positioning.
📌 Short-Term Setup Possibility
If price pulls back into one of these blue boxes and shows signs of strength with lower timeframe confirmation, a trade can be considered to ride the next move up. The goal here isn't to catch a massive breakout, but to participate in a measured reaction from clear demand zones.
📉 Be Realistic With Expectations
This is not a setup where targeting extremely high levels is ideal. Being overly persistent in such structures can quickly turn a smart trade into an emotional one. Take what the market gives and manage risk accordingly.
🧠 Why This Works
This approach isn't random. It's based on the flow of buyers, reaction zones, and a calculated strategy that’s worked time and time again. You’re not just following levels. You’re following experience, precision, and a track record that speaks for itself.
Every level shared here is part of a bigger picture, and if you’re reading this, you already know the difference it makes when you follow someone who actually understands the game.
📌I keep my charts clean and simple because I believe clarity leads to better decisions.
📌My approach is built on years of experience and a solid track record. I don’t claim to know it all but I’m confident in my ability to spot high-probability setups.
📌If you would like to learn how to use the heatmap, cumulative volume delta and volume footprint techniques that I use below to determine very accurate demand regions, you can send me a private message. I help anyone who wants it completely free of charge.
🔑I have a long list of my proven technique below:
I stopped adding to the list because it's kinda tiring to add 5-10 charts in every move but you can check my profile and see that it goes on..
📌 Short-Term Setup Possibility
If price pulls back into one of these blue boxes and shows signs of strength with lower timeframe confirmation, a trade can be considered to ride the next move up. The goal here isn't to catch a massive breakout, but to participate in a measured reaction from clear demand zones.
📉 Be Realistic With Expectations
This is not a setup where targeting extremely high levels is ideal. Being overly persistent in such structures can quickly turn a smart trade into an emotional one. Take what the market gives and manage risk accordingly.
🧠 Why This Works
This approach isn't random. It's based on the flow of buyers, reaction zones, and a calculated strategy that’s worked time and time again. You’re not just following levels. You’re following experience, precision, and a track record that speaks for itself.
Every level shared here is part of a bigger picture, and if you’re reading this, you already know the difference it makes when you follow someone who actually understands the game.
📌I keep my charts clean and simple because I believe clarity leads to better decisions.
📌My approach is built on years of experience and a solid track record. I don’t claim to know it all but I’m confident in my ability to spot high-probability setups.
📌If you would like to learn how to use the heatmap, cumulative volume delta and volume footprint techniques that I use below to determine very accurate demand regions, you can send me a private message. I help anyone who wants it completely free of charge.
🔑I have a long list of my proven technique below:
- 🎯 ZENUSDT.P: Patience & Profitability | %230 Reaction from the Sniper Entry
- 🐶 DOGEUSDT.P: Next Move
- 🎨 RENDERUSDT.P: Opportunity of the Month
- 💎 ETHUSDT.P: Where to Retrace
- 🟢 BNBUSDT.P: Potential Surge
- 📊 BTC Dominance: Reaction Zone
- 🌊 WAVESUSDT.P: Demand Zone Potential
- 🟣 UNIUSDT.P: Long-Term Trade
- 🔵 XRPUSDT.P: Entry Zones
- 🔗 LINKUSDT.P: Follow The River
- 📈 BTCUSDT.P: Two Key Demand Zones
- 🟩 POLUSDT: Bullish Momentum
- 🌟 PENDLEUSDT.P: Where Opportunity Meets Precision
- 🔥 BTCUSDT.P: Liquidation of Highly Leveraged Longs
- 🌊 SOLUSDT.P: SOL's Dip - Your Opportunity
- 🐸 1000PEPEUSDT.P: Prime Bounce Zone Unlocked
- 🚀 ETHUSDT.P: Set to Explode - Don't Miss This Game Changer
- 🤖 IQUSDT: Smart Plan
- ⚡️ PONDUSDT: A Trade Not Taken Is Better Than a Losing One
- 💼 STMXUSDT: 2 Buying Areas
- 🐢 TURBOUSDT: Buy Zones and Buyer Presence
- 🌍 ICPUSDT.P: Massive Upside Potential | Check the Trade Update For Seeing Results
- 🟠 IDEXUSDT: Spot Buy Area | %26 Profit if You Trade with MSB
- 📌 USUALUSDT: Buyers Are Active + %70 Profit in Total
- 🌟 FORTHUSDT: Sniper Entry +%26 Reaction
- 🐳 QKCUSDT: Sniper Entry +%57 Reaction
- 📊 BTC.D: Retest of Key Area Highly Likely
- 📊 XNOUSDT %80 Reaction with a Simple Blue Box!
- 📊 BELUSDT Amazing %120 Reaction!
I stopped adding to the list because it's kinda tiring to add 5-10 charts in every move but you can check my profile and see that it goes on..
Professional Day Trader
Microstructure Practicioner
t.me/umuttrades
kick.com/umuttrades live everyday.
Microstructure Practicioner
t.me/umuttrades
kick.com/umuttrades live everyday.
Related publications
Disclaimer
The information and publications are not meant to be, and do not constitute, financial, investment, trading, or other types of advice or recommendations supplied or endorsed by TradingView. Read more in the Terms of Use.