Where We Were – Market Structure Recap,
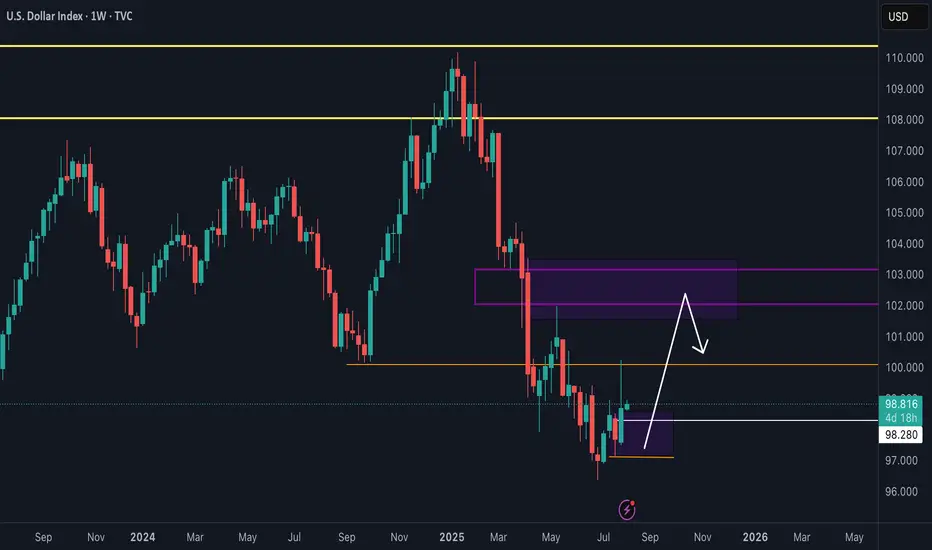
The Dollar Index completed a six-month range (110.176 to 96.768) with a bearish engulfing pattern, signaling long-term weakness. From March to June, DXY printed consistent lower lows and closes. July marked a shift with a higher high and close, indicating a possible retracement toward premium levels within the broader downtrend.
Where We Are Now – Current Market Conditions,
DXY is trading near the bottom of its range, interacting with a monthly price imbalance. Last week’s candle closed higher (higher high, higher close), suggesting short-term bullish control.
On the daily timeframe, structure has shifted into a potential sell-to-buy scenario. A new range is defined, and the 62% Fibonacci retracement overlaps with a bearish order block — a likely accumulation zone. The recent daily low is now critical support for this short-term bullish case.
Where We’re Going – Weekly Outlook,
The immediate outlook favors a bullish retracement targeting liquidity above last week’s high and into the monthly imbalance. If support holds, continuation toward premium levels is likely. A break below support invalidates the bullish scenario and shifts the structure bearish.
A false break and rejection (turtle soup) could still keep the bullish case intact if followed by strong buy pressure.
Video Link: youtube.com/watch?v=n0xfbj4WD_0
Disclaimer
The information and publications are not meant to be, and do not constitute, financial, investment, trading, or other types of advice or recommendations supplied or endorsed by TradingView. Read more in the Terms of Use.
Disclaimer
The information and publications are not meant to be, and do not constitute, financial, investment, trading, or other types of advice or recommendations supplied or endorsed by TradingView. Read more in the Terms of Use.