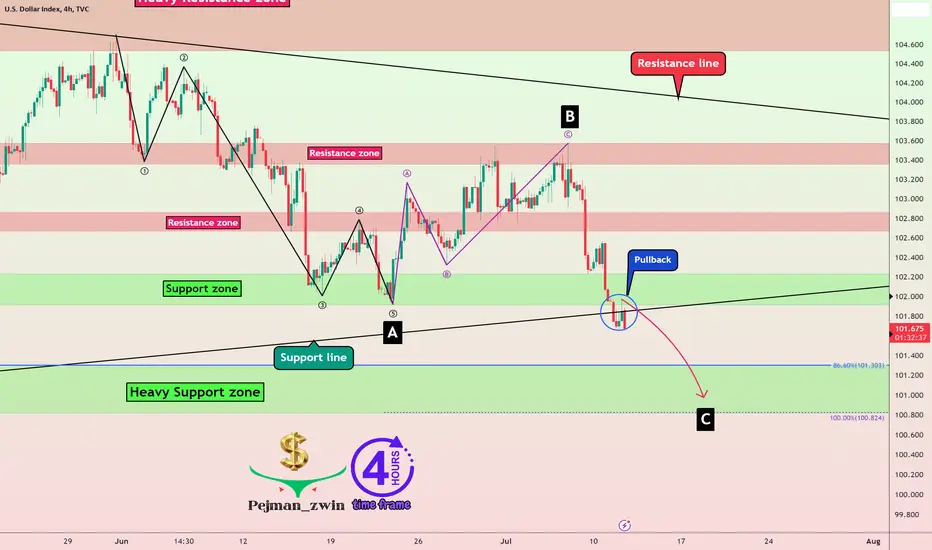
DXY index managed to break the 🟢support zone($102.24-$101.91)🟢 and support line during the last day.
Based on the theory of Elliott waves, the DXY indicator is completing a corrective Zigzag structure(ABC/5-3-5).
🔔I expect the main wave C to finish at the 🟢heavy support zone($101.30-$100.82)🟢.
U.S.Dollar Currency Index ( DXYUSD ) Analyze, 4-hour time frame⏰.
Do not forget to put Stop loss for your positions (For every position you want to open).
Please follow your strategy, this is just my Idea, and I will be glad to see your ideas in this post.
Please do not forget the ✅' like'✅ button 🙏😊 & Share it with your friends; thanks, and Trade safe.
Trade active
Trade closed: target reached
🎁Welcome than a 50% bonus(Low Spread)👉vtm.pro/Y3AV7r
🎁Get a 20% Discount on your trading FEE on BYBIT:👉partner.bybit.com/b/PEJMANZWIN
🎁Get a 20% Bonus & 30% Discount on LBANK exchange(NO KYC)👉lbank.one/join/uBythQd
🎁Get a 20% Discount on your trading FEE on BYBIT:👉partner.bybit.com/b/PEJMANZWIN
🎁Get a 20% Bonus & 30% Discount on LBANK exchange(NO KYC)👉lbank.one/join/uBythQd
Related publications
Disclaimer
The information and publications are not meant to be, and do not constitute, financial, investment, trading, or other types of advice or recommendations supplied or endorsed by TradingView. Read more in the Terms of Use.