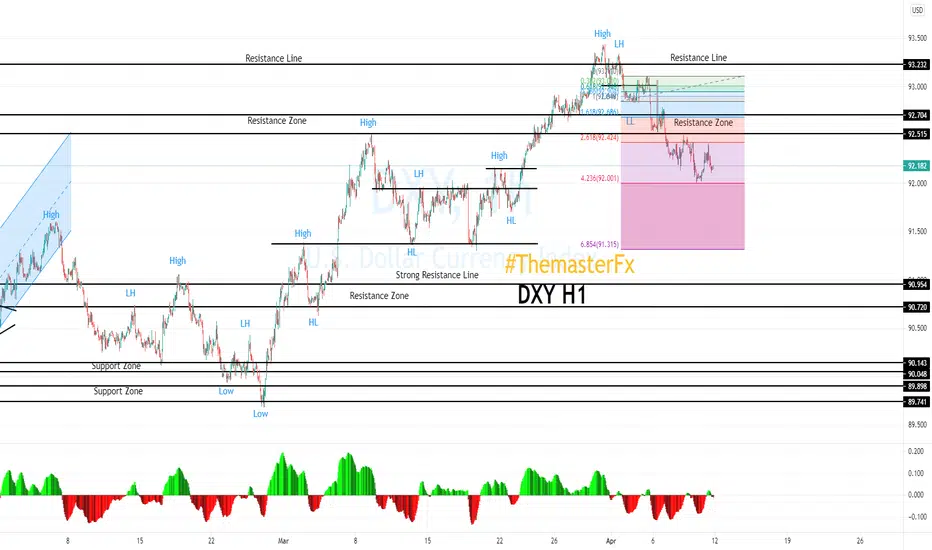
DXY on the 1H time-frame.
Steps:
1. The index created the lower high and breakout the previous low to confirmed the reversal pattern.
2. The index was running downtrend and already hit the Fibonacci level 423.6%
3. If the index breakout the previous low at 92.001 then the next level will be at the Fibonacci 685.4% at 91.315 or 91.378 at the support zone.
Disclaimer
The information and publications are not meant to be, and do not constitute, financial, investment, trading, or other types of advice or recommendations supplied or endorsed by TradingView. Read more in the Terms of Use.
Disclaimer
The information and publications are not meant to be, and do not constitute, financial, investment, trading, or other types of advice or recommendations supplied or endorsed by TradingView. Read more in the Terms of Use.