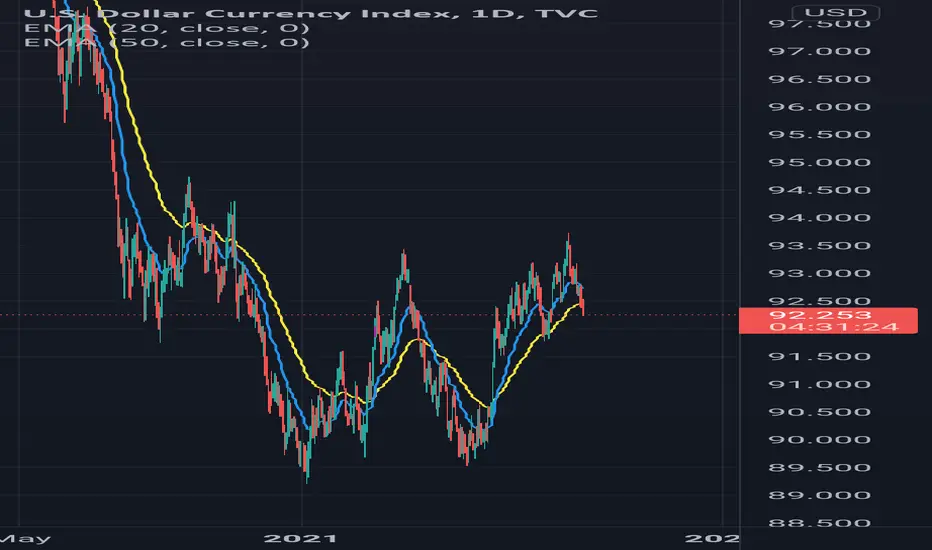
Time Frame: Daily candle
Indicators: 50 EMA
Line: Horizontal ( neck line)
Price Action is more accurate on big time frame. & Market always sustain around neck line. If it breaks with good strength we can see upside trend. So bullish on DXY.
Cadle is also taking support at 50 EMA.
Indicators: 50 EMA
Line: Horizontal ( neck line)
Price Action is more accurate on big time frame. & Market always sustain around neck line. If it breaks with good strength we can see upside trend. So bullish on DXY.
Cadle is also taking support at 50 EMA.
Disclaimer
The information and publications are not meant to be, and do not constitute, financial, investment, trading, or other types of advice or recommendations supplied or endorsed by TradingView. Read more in the Terms of Use.
Disclaimer
The information and publications are not meant to be, and do not constitute, financial, investment, trading, or other types of advice or recommendations supplied or endorsed by TradingView. Read more in the Terms of Use.