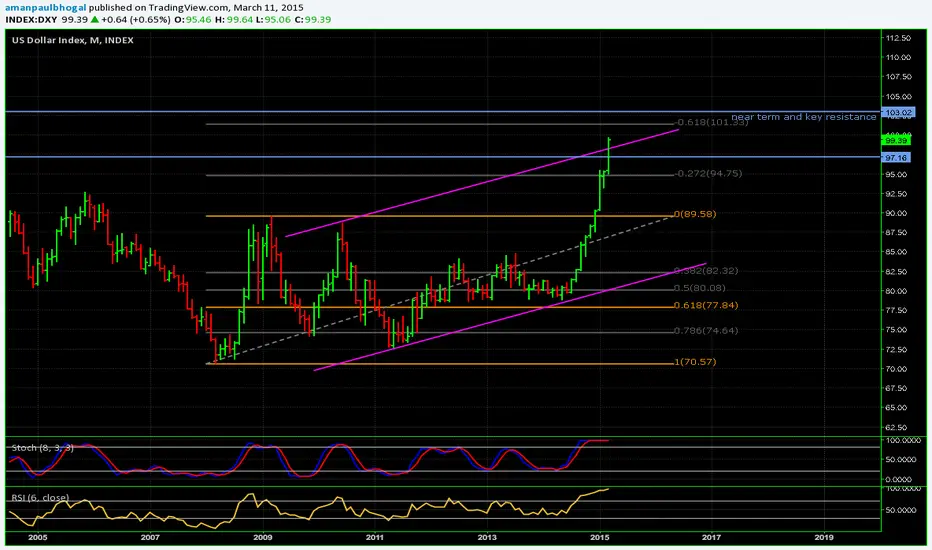
On the monthly chart, the US Dollar Index has soared without a pull back since May 2014 leaving questions for a possible future retracement. Approaching the 1.618 Fibonacci extension (~101) and previous key resistance at 103 is a price region where the effect on price action behaviour will be of significant interest from a technical perspective to witness a potential pullback. Until then, Dixie continues to cycle offering short to medium-term long opportunities on the daily time frame.
Disclaimer
The information and publications are not meant to be, and do not constitute, financial, investment, trading, or other types of advice or recommendations supplied or endorsed by TradingView. Read more in the Terms of Use.
Disclaimer
The information and publications are not meant to be, and do not constitute, financial, investment, trading, or other types of advice or recommendations supplied or endorsed by TradingView. Read more in the Terms of Use.