Here’s the English description of the two scenarios in your chart:
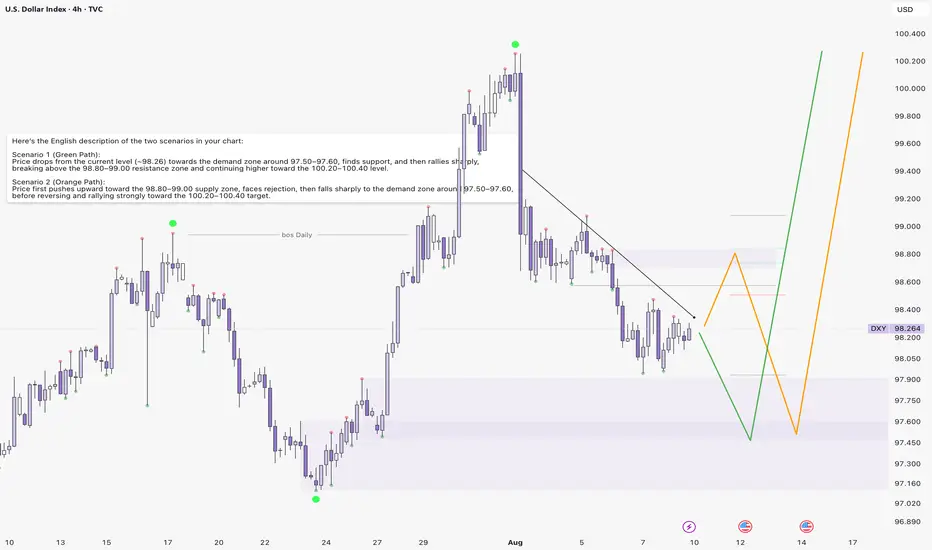
Scenario 1 (Green Path):
Price drops from the current level (~98.26) towards the demand zone around 97.50–97.60, finds support, and then rallies sharply, breaking above the 98.80–99.00 resistance zone and continuing higher toward the 100.20–100.40 level.
Scenario 2 (Orange Path):
Price first pushes upward toward the 98.80–99.00 supply zone, faces rejection, then falls sharply to the demand zone around 97.50–97.60, before reversing and rallying strongly toward the 100.20–100.40 target.
Disclaimer
The information and publications are not meant to be, and do not constitute, financial, investment, trading, or other types of advice or recommendations supplied or endorsed by TradingView. Read more in the Terms of Use.
Disclaimer
The information and publications are not meant to be, and do not constitute, financial, investment, trading, or other types of advice or recommendations supplied or endorsed by TradingView. Read more in the Terms of Use.