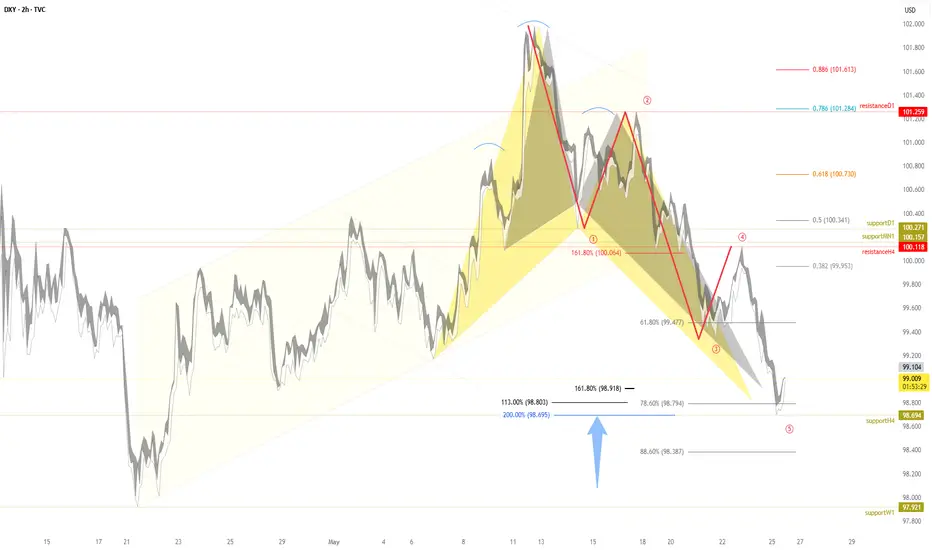
Over recent sessions, I’ve been highlighting a critical zone for the
➡️ The dollar broke below the Head and Shoulders neckline at $100.27, hitting the default target I projected at $98.69, which corresponds to the 200% Fibonacci extension. This is a classic confirmation of the breakdown and subsequent drop.
➡️ However, since reaching this level, the
Bullish Crab Pattern at the 161.8% Fibonacci extension, projected at $98.91
Bullish Alt-Bat Pattern at the 113% Fibonacci extension, at $98.80
These emerging bullish setups suggest a solid potential reversal, indicating that the
🎯 The default targets for these bullish patterns are around $99.95, aligning with key resistance zones and Fibonacci confluence.
Summary: The
Safe Traders,
André Cardoso
Harmonic Patterns | Market Analyst | Forex Analytix | Porto, Portugal
Related publications
Disclaimer
The information and publications are not meant to be, and do not constitute, financial, investment, trading, or other types of advice or recommendations supplied or endorsed by TradingView. Read more in the Terms of Use.