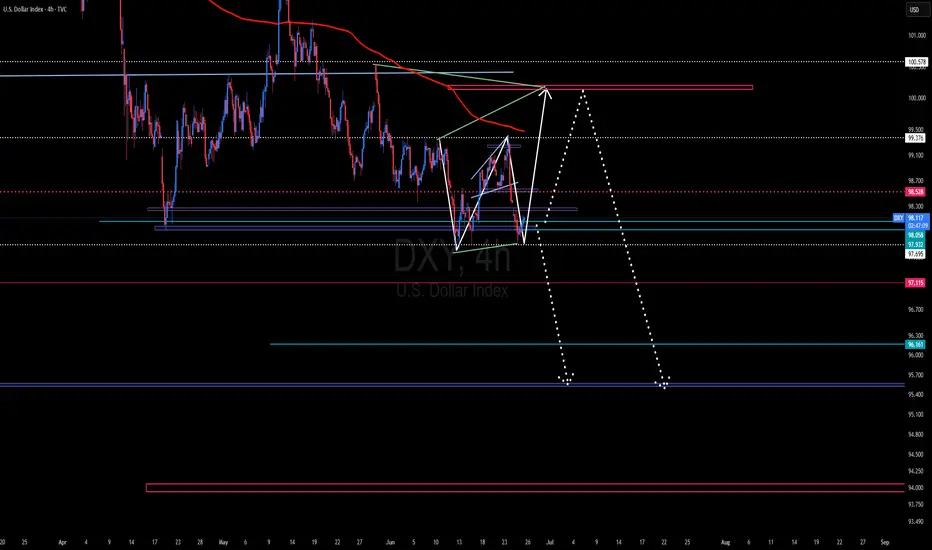
The DXY (US Dollar Index) could potentially rise to the 100.257 level to complete a bullish structure or flag pattern. However, it's also possible that it may face rejection around its current zone and resume its bearish trend, targeting support levels between 99.00 and 98.25.
As always, our entries should be guided by what the market and its structure are showing us. For now, the broader trend for the DXY remains bearish until it potentially reaches the lower support zone around 96.00 – 94.00, or even below that range.
This extended downside expectation is driven by several fundamental factors: anticipations of interest rate cuts in the coming months, potential tax policy changes under Trump, and persistent inflation concerns within the U.S. economy.
In light of these uncertainties, the market demands extra caution at this stage.
Good luck and trade safe!
Trade active
Note
Disclaimer
The information and publications are not meant to be, and do not constitute, financial, investment, trading, or other types of advice or recommendations supplied or endorsed by TradingView. Read more in the Terms of Use.
Disclaimer
The information and publications are not meant to be, and do not constitute, financial, investment, trading, or other types of advice or recommendations supplied or endorsed by TradingView. Read more in the Terms of Use.