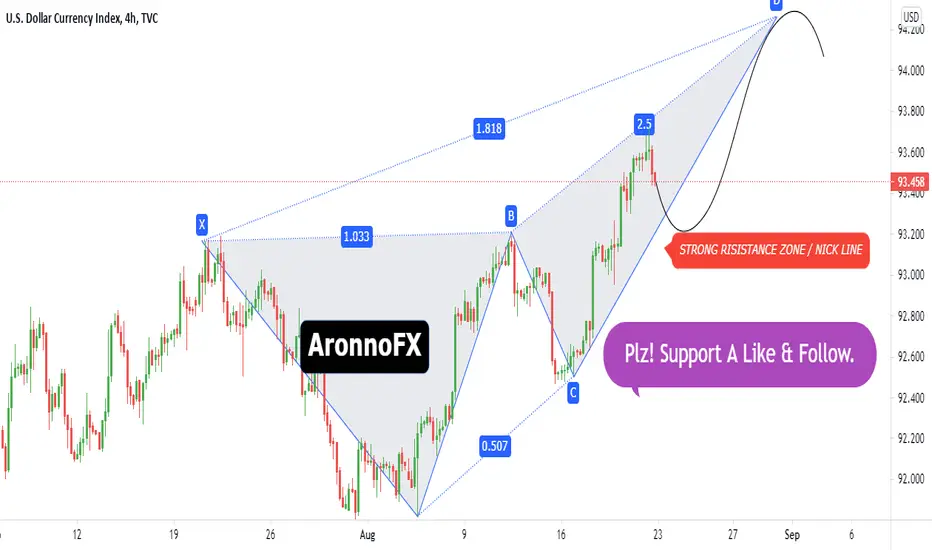
DXY chart long term chart hopefully create butterfly pattern.
So, The market goes Up to 93.973 & 94.261 resistance zone. If breakout
92.900 support zone then market goes down to 92.560 support zone.
If you like this idea, do not forget to support with a like and follow.
Traders, if you like this idea or have your own opinion about it,
write in the comments. I will be glad
Related publications
Disclaimer
The information and publications are not meant to be, and do not constitute, financial, investment, trading, or other types of advice or recommendations supplied or endorsed by TradingView. Read more in the Terms of Use.
Related publications
Disclaimer
The information and publications are not meant to be, and do not constitute, financial, investment, trading, or other types of advice or recommendations supplied or endorsed by TradingView. Read more in the Terms of Use.