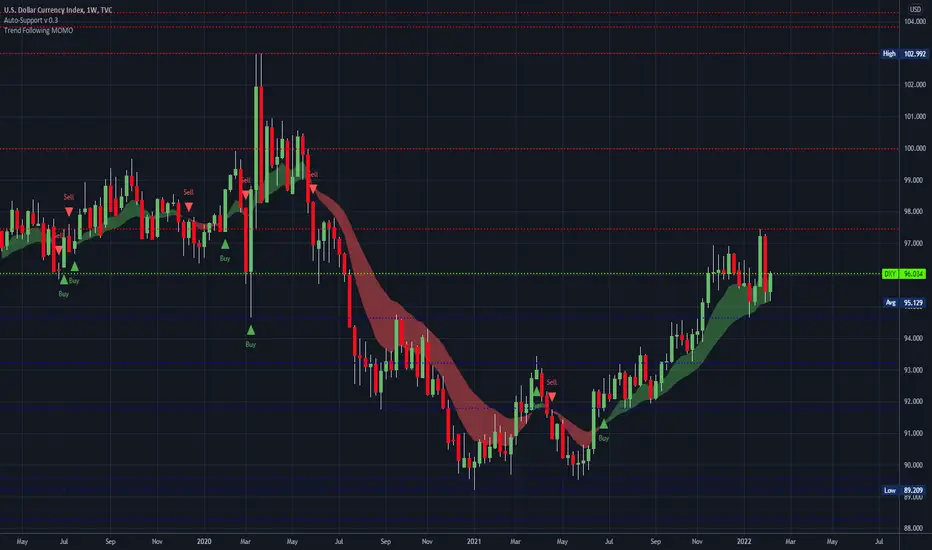
The weekly price chart below shows the U.S. Dollar Index printed a small bullish pin bar last week, as the price continued its consolidation between the support level at 12086 and the resistance level at 12293. The price is obviously consolidating but there is still a long-term bullish trend in force, with the price higher than where it was 3 and 6 months ago.
If the support level at 12086 continues to hold, the long-term bullish trend will be likely to resume.
Overall, it seems clear we still have bullish picture in the USD over the long and medium terms, but in the Forex market the greenback may not be the main driver of prices right now. It may be a better time to trade currency crosses not involving the USD.
Disclaimer
The information and publications are not meant to be, and do not constitute, financial, investment, trading, or other types of advice or recommendations supplied or endorsed by TradingView. Read more in the Terms of Use.
Disclaimer
The information and publications are not meant to be, and do not constitute, financial, investment, trading, or other types of advice or recommendations supplied or endorsed by TradingView. Read more in the Terms of Use.