📊 DXY (US Dollar Index) – Daily Analysis
Market Structure:
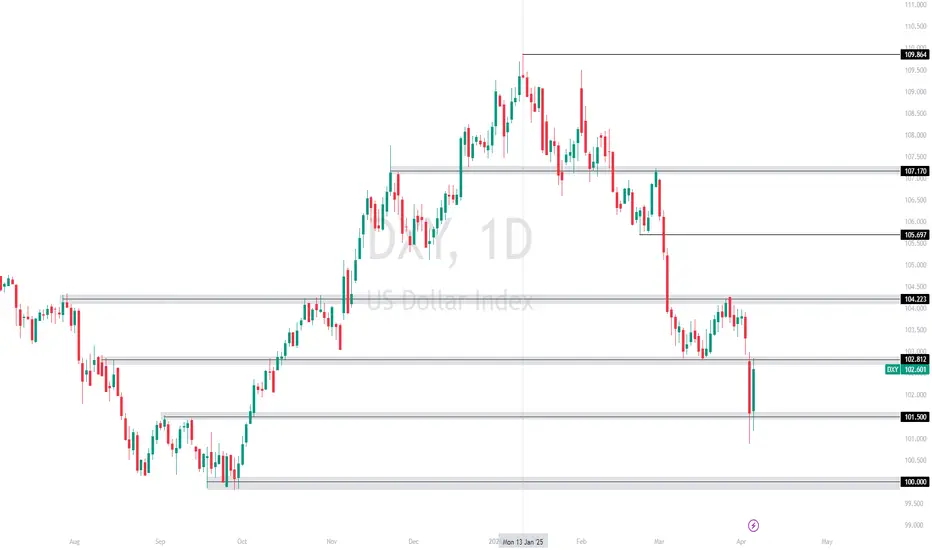
📉 DXY remains in a bearish structure on the daily, making lower highs and lower lows.
💥 Price is currently testing the key 102.812 support level.
-Previous Trend: The market had a strong bullish move from around October to late December 2024.
🌎 Ongoing tariff tensions between the US and other countries have increased market volatility.
📈 Bullish Scenario:
✅ If DXY sustains above 102.812, a push towards 104.223 resistance is possible.
🚀 A clean break and retest above 104.223 could open the way for continuation towards 105.67 and 107.170.
📉 Bearish Scenario:
⚠️ If DXY fails to hold above 102.812, expect a drop towards 101.500.
🔄 In this case, 102.812 could flip into new resistance, confirming bearish momentum.
📉 A breakdown below 101.500 would likely expose DXY to the 100.000 psychological support level.
🔻 Tariff-driven risk-off sentiment could accelerate the move lower.
⚠️ Risk Disclaimer:
This analysis is for informational purposes only and does not constitute financial advice or a trading signal. Market conditions can change rapidly, especially with ongoing tariff talks and geopolitical developments. Always confirm market conditions using your own strategy before making any trading decisions.
Market Structure:
📉 DXY remains in a bearish structure on the daily, making lower highs and lower lows.
💥 Price is currently testing the key 102.812 support level.
-Previous Trend: The market had a strong bullish move from around October to late December 2024.
🌎 Ongoing tariff tensions between the US and other countries have increased market volatility.
📈 Bullish Scenario:
✅ If DXY sustains above 102.812, a push towards 104.223 resistance is possible.
🚀 A clean break and retest above 104.223 could open the way for continuation towards 105.67 and 107.170.
📉 Bearish Scenario:
⚠️ If DXY fails to hold above 102.812, expect a drop towards 101.500.
🔄 In this case, 102.812 could flip into new resistance, confirming bearish momentum.
📉 A breakdown below 101.500 would likely expose DXY to the 100.000 psychological support level.
🔻 Tariff-driven risk-off sentiment could accelerate the move lower.
⚠️ Risk Disclaimer:
This analysis is for informational purposes only and does not constitute financial advice or a trading signal. Market conditions can change rapidly, especially with ongoing tariff talks and geopolitical developments. Always confirm market conditions using your own strategy before making any trading decisions.
Disclaimer
The information and publications are not meant to be, and do not constitute, financial, investment, trading, or other types of advice or recommendations supplied or endorsed by TradingView. Read more in the Terms of Use.
Disclaimer
The information and publications are not meant to be, and do not constitute, financial, investment, trading, or other types of advice or recommendations supplied or endorsed by TradingView. Read more in the Terms of Use.