Potential Head and Shoulders or Double Top Formation:
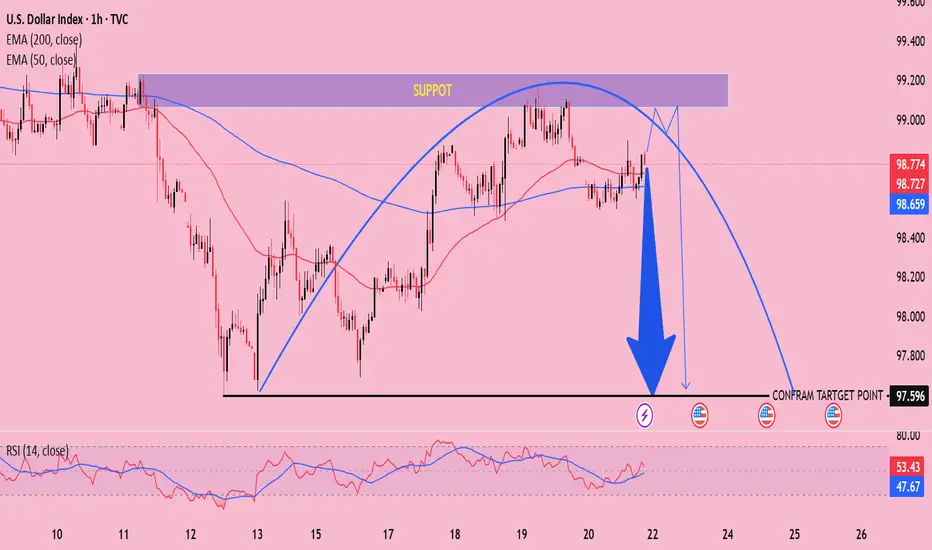
The blue curved line and the shaded “SUPPORT” zone at the top suggest a reversal pattern.
The large blue arrow indicates a bearish projection after failing to break the resistance zone (~99.200).
📊 Key Indicators:
EMAs (Exponential Moving Averages):
50 EMA (Red): 98.727
200 EMA (Blue): 98.659
Price is currently above both EMAs, which typically signals bullish momentum in the short term, but the drawn pattern suggests a pending reversal.
RSI (Relative Strength Index):
Current values: ~53.43 (RSI), ~47.67 (Signal line)
RSI is near the midpoint (50), indicating no strong momentum in either direction yet, but possibly setting up for a decline if it moves below 50.
🟪 Resistance Zone:
Highlighted in purple: ~99.100–99.250.
The price has tested this area and failed to break it, indicating strong selling pressure.
🔻 Bearish Outlook:
The large blue arrow suggests a drop toward the "CONFIRM TARGET POINT" at 97.596.
Breakdown below the black horizontal support line would confirm the bearish move.
📉 Conclusion:
This chart analysis suggests a bearish reversal is likely, supported by:
A resistance rejection at ~99.2
Formation of a reversal pattern
EMA convergence (potential crossover if trend continues)
Neutral RSI with a potential bearish divergence
⚠️ Watch For:
Confirmation with a break below 98.400 and especially the support line at ~97.596.
RSI dropping below 50.
EMA crossover (50 EMA crossing below 200 EMA) would strengthen the bearish case.
Market Analysts, Mentor, Forex Trader.
XAUUSD Trader
FREE ANALYSIS AT ENTRY POINT.
Your Growth Is My Priority
t.me/ITCSMCTradingStrategies
XAUUSD Trader
FREE ANALYSIS AT ENTRY POINT.
Your Growth Is My Priority
t.me/ITCSMCTradingStrategies
Disclaimer
The information and publications are not meant to be, and do not constitute, financial, investment, trading, or other types of advice or recommendations supplied or endorsed by TradingView. Read more in the Terms of Use.