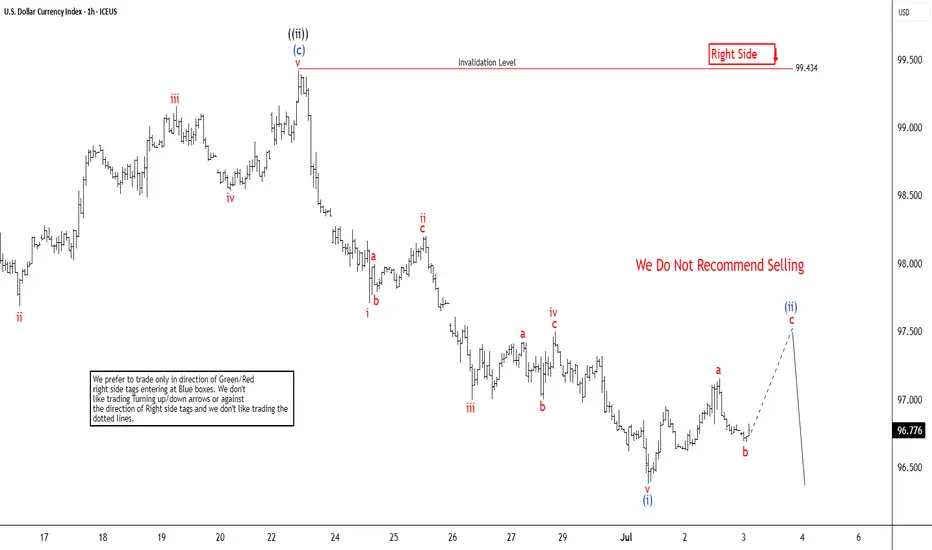
The Dollar Index (DXY) cycle, originating from its September 2022 peak, remains incomplete and exhibits a bearish outlook, signaling potential for further declines. The descent from the May 29, 2025 high is currently unfolding as a five-wave impulse pattern. From this high, wave ((i)) concluded at 98.35, followed by a corrective rally in wave ((ii)). The rally formed as an expanded flat, peaking at 99.43 as depicted on the one-hour chart below.
Subsequently, the Index extended lower, forming a nested structure. Within this decline from wave ((ii)), wave i bottomed at 97.7, with a corrective wave ii rally reaching 98.2. Wave iii then drove the Index lower to 97, followed by wave iv peaking at 97.49. The final leg, wave v, completed at 96.37, marking the end of wave (i). Currently, a corrective rally in wave (ii) is underway, aiming to retrace the decline from the June 23, 2025 peak. This rally appears to be unfolding as a zigzag pattern, with wave a concluding at 97.15 and wave b dipping to 96.69. Wave c is expected to target the 100%–161.8% Fibonacci extension of wave a, projecting a range of 97.45–97.9.
Should the Index reach this zone, it may encounter selling pressure, potentially leading to further downside or a three-wave pullback. As long as the pivot high at 99.4 remains intact, any rally is likely to falter in a 3, 7, or 11-swing structure, reinforcing the bearish bias for additional declines.
14 days trial --> elliottwave-forecast.com/plan-trial/ and get Accurate & timely Elliott Wave Forecasts of 78 instruments. Webinars, Chat Room, Stocks/Forex/Indices Signals & more.
Disclaimer
The information and publications are not meant to be, and do not constitute, financial, investment, trading, or other types of advice or recommendations supplied or endorsed by TradingView. Read more in the Terms of Use.