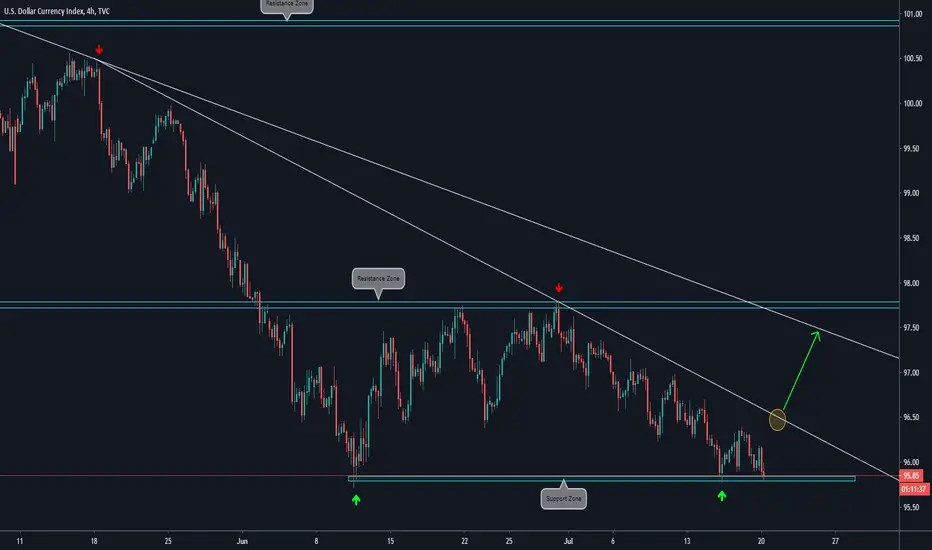
🔸 4H CHART EXPLANATION:
.
.
🔸Price is facing the Support Zone at the previous lows.
.
🔸We consider that if price bounces here, it could be a bullish move towards the Descending Trendline of the last bearish impulse.
.
🔸Before trading in that direction, we will wait for the short term Descending Trendline to be broken.
.
🔸 Will look for a lower timeframe bullish setup.
🔸 DAILY CHART ANALYSIS:

.
.
🔸Price is facing the Support Zone at the previous lows.
.
🔸We consider that if price bounces here, it could be a bullish move towards the Descending Trendline of the last bearish impulse.
.
🔸Before trading in that direction, we will wait for the short term Descending Trendline to be broken.
.
🔸 Will look for a lower timeframe bullish setup.
🔸 DAILY CHART ANALYSIS:
Disclaimer
The information and publications are not meant to be, and do not constitute, financial, investment, trading, or other types of advice or recommendations supplied or endorsed by TradingView. Read more in the Terms of Use.
Disclaimer
The information and publications are not meant to be, and do not constitute, financial, investment, trading, or other types of advice or recommendations supplied or endorsed by TradingView. Read more in the Terms of Use.