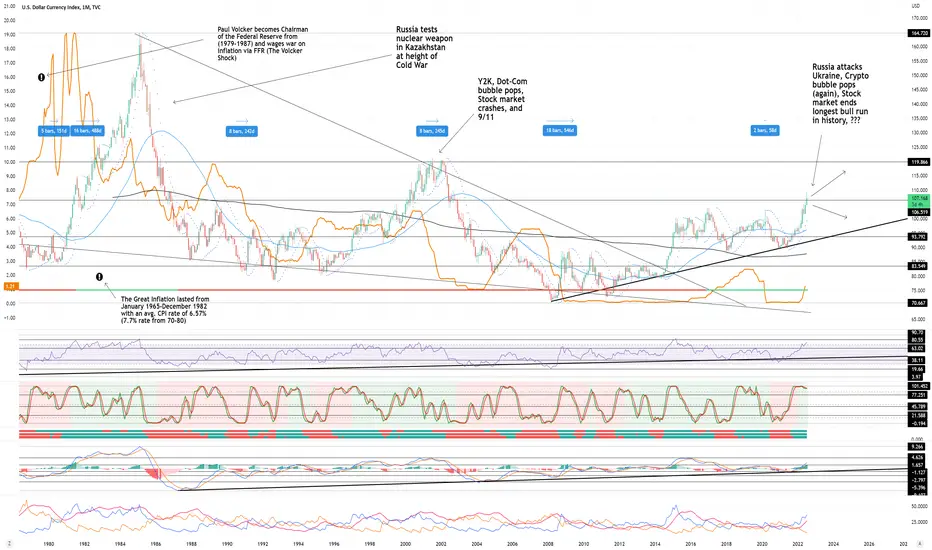
DXY Monthly cautiously bullish. Recommended ratio: 70% DXY, 30% Cash. *SPECULATION POST. This is my most ambitious TA yet, it is entirely speculative and inspired by recent geopolitical and macroeconomic events. On the left Y-Axis is the FFR to show the visual relationship between DXY and FFR. This chart essentially posits that we are on the brink of something really breaking and is meant to guide investors as to what kind of volatility/turmoil potentially lies ahead. The six blue bars are the past six recessions after 1979 as declared by the National Economic Research Bureau (NERB). Ways that we can get to $120 DXY (these events can be singular or mixed and matched): a) Nancy Pelosi defies Chinese requests and flies to Taiwan, b) USA or NATO member directly intervenes in Russia/Ukraine war (providing fighter jets, sending infantry units, etc.), c) China attacks Taiwan, d) China exacerbates Covid-19 lockdowns, e) countries begin imposing Monkey Pox lockdowns, f) US (and world) enters deep recession, g) Federal Reserve continues raising rates beyond 3.5%, h) I'm probably missing some potential events so please post a comment if you can think of any others.* Price is currently trending up at $107.20 as it attempts to break above $106.52 resistance. Parabolic SAR flips bearish at ~$99, this is neutral at the moment. RSI is currently trending up at 75 after bouncing at 67, the next resistance is at 80.55 while the next support is at 63. Stochastic remains bearish but is currently forming a trough in the 'bullish autobahn zone' as it attempts to cross over bullish at 94, if it can do this then the next resistance is max top. MACD remains bullish and is currently trending up at 2.40 with no signs of peak formation as it still technically tests 1.66 resistance; the next resistance is at 4.63. ADX is currently trending up at 26.46 as Price continues seeing buying pressure, this is bullish. If Price is able to break above $106.52 resistance and turn it to support, the next resistance is at $120. However, if Price is rejected here, it will likely retest the 50 MA at ~$97 before potentially retesting the uptrend line from March 2008 as support at ~$95. Mental Stop Loss: (two consecutive closes below) $106.
Note
Correction: NBER (National Bureau of Economic Research)Disclaimer
The information and publications are not meant to be, and do not constitute, financial, investment, trading, or other types of advice or recommendations supplied or endorsed by TradingView. Read more in the Terms of Use.
Disclaimer
The information and publications are not meant to be, and do not constitute, financial, investment, trading, or other types of advice or recommendations supplied or endorsed by TradingView. Read more in the Terms of Use.